· HOOK
Wattlas
European electricity, explained. Open data on how and when the price of power moves across the continent — pre-computed into views you can actually read, and rebuilt every day.
A working tool you can open right now, not a pitch.
· 26 VIEWS · FIVE QUESTIONS
Not eight tools in a menu — five questions about power
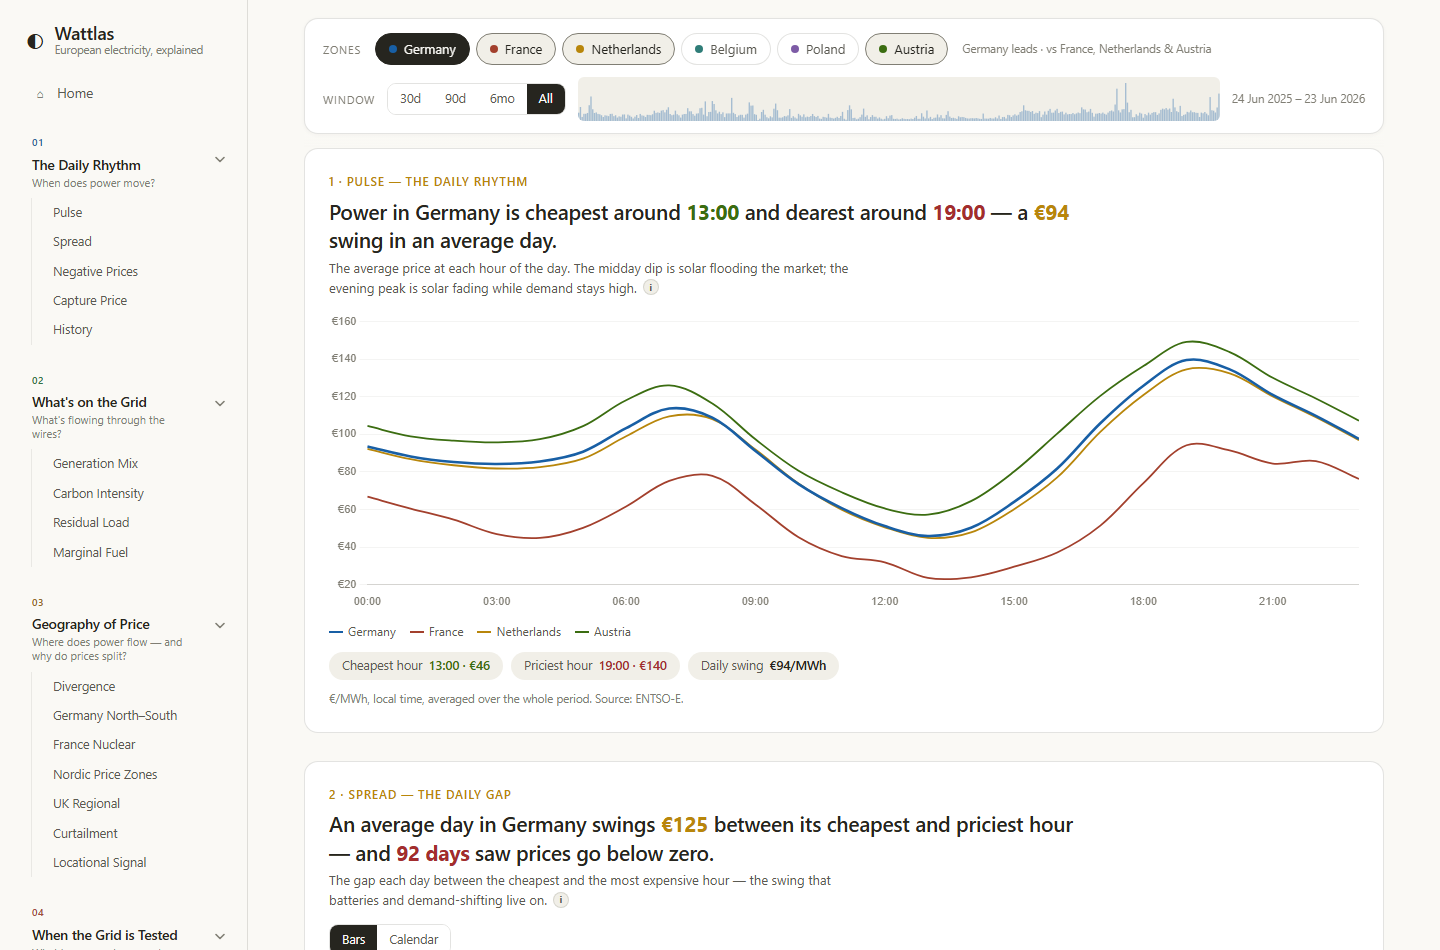
An editorial landing routes you into one of five plain-language questions; each opens a section of views that answer it. Every view can still compare up to six bidding zones at once — here Germany against France, the Netherlands and Austria.
01 · The Daily RhythmWhen does power move?
02 · What's on the GridWhat's flowing through the wires?
03 · Geography of PriceWhere does power flow — and why do prices split?
04 · When the Grid is TestedWhat happens when supply runs tight?
05 · The BillWhat does it cost, and who pays?
Grouped by the question you came to answer, not by how it was built.
Chart · 1 of 5
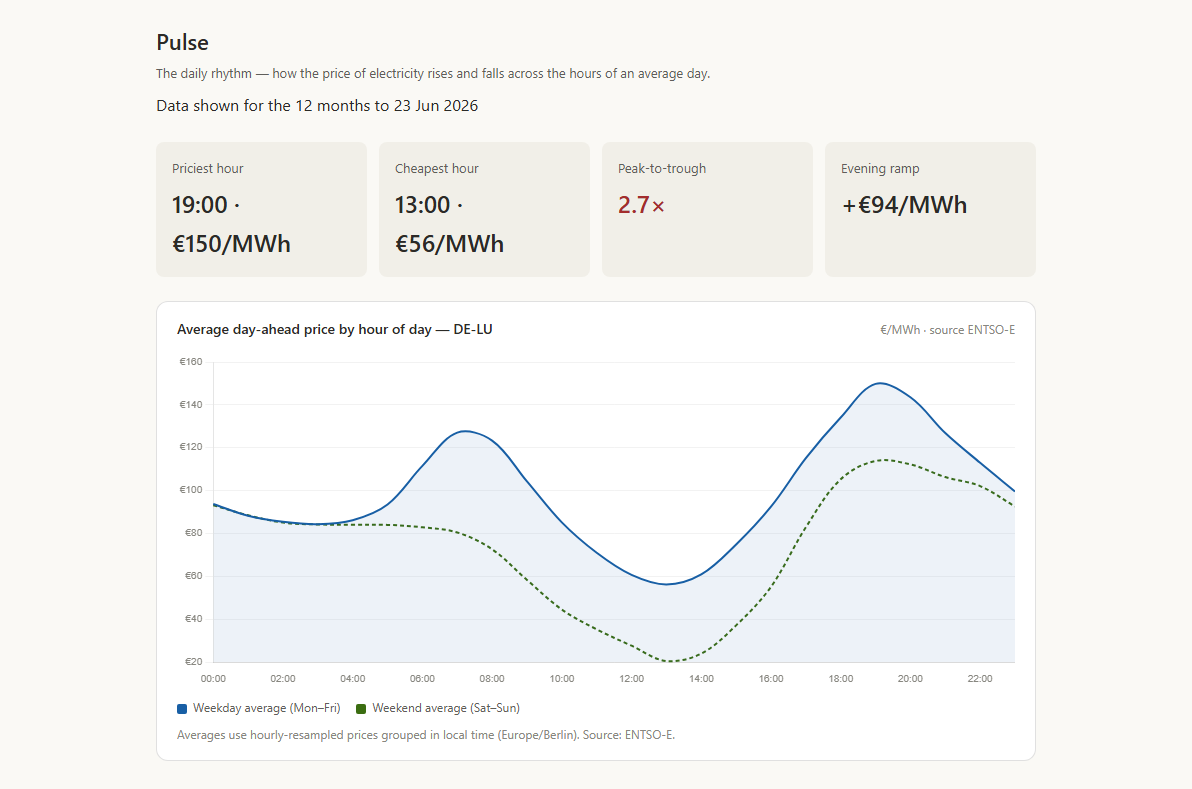
Pulse
When is power cheapest, and when does it cost the most?
Average day-ahead price by hour of day — the duck curve. Solar floods the midday hours and drags the price toward (and often below) zero; then it spikes after sunset as demand peaks and solar drops out. Weekday against weekend, per zone.
−€18 → €142midday vs evening, average hour
Chart · 2 of 5
Spread
How wide is the gap between the cheapest and dearest hour each day?
The daily top-to-bottom spread — the signal a battery lives on — averaging roughly €96/MWh. Negative-price days are flagged, and a perfect-foresight arbitrage figure is shown, always labelled an unachievable upper bound, never a revenue promise.
€96/MWhaverage daily top–bottom spread
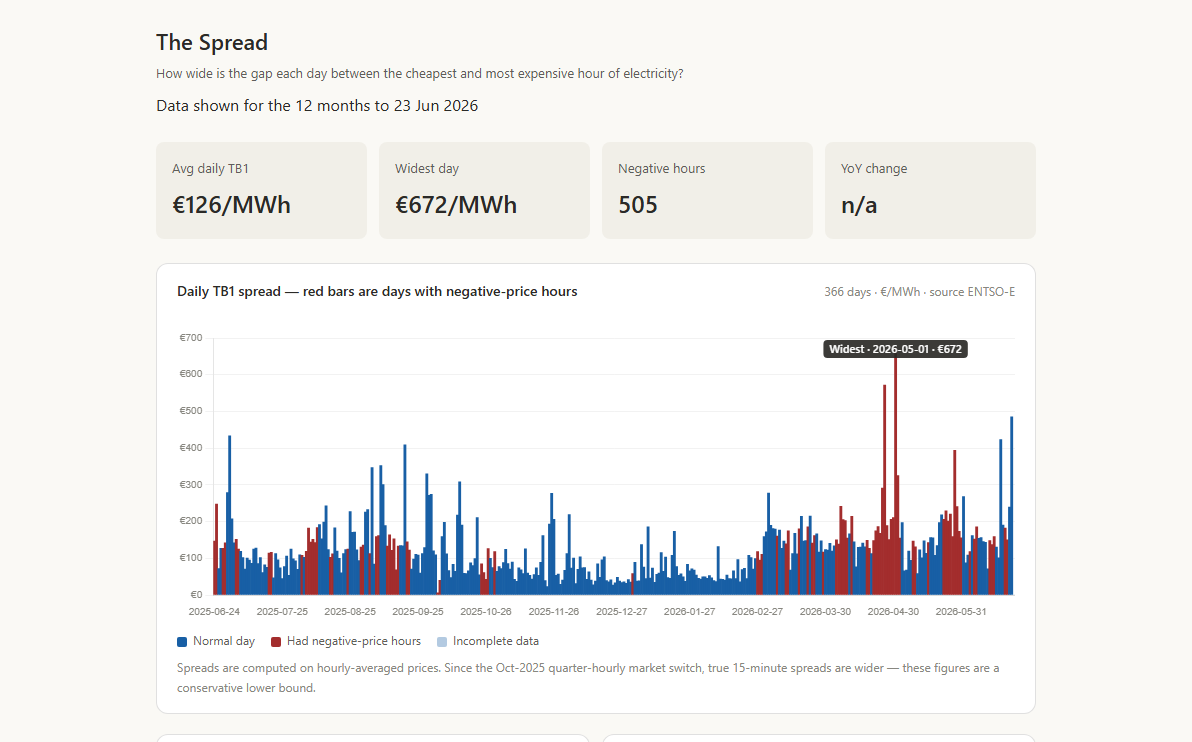
Chart · 3 of 5
Negative Prices
How often does the grid pay you to consume?
The hours the wholesale price falls below zero — promoted from a footnote to a metric of its own, with ~468 of them in the last twelve months. Counts the sub-zero hours per day, the longest episodes, and a calendar of when oversupply tips the price negative. They are kept, never clipped.
468 hbelow zero, last 12 months
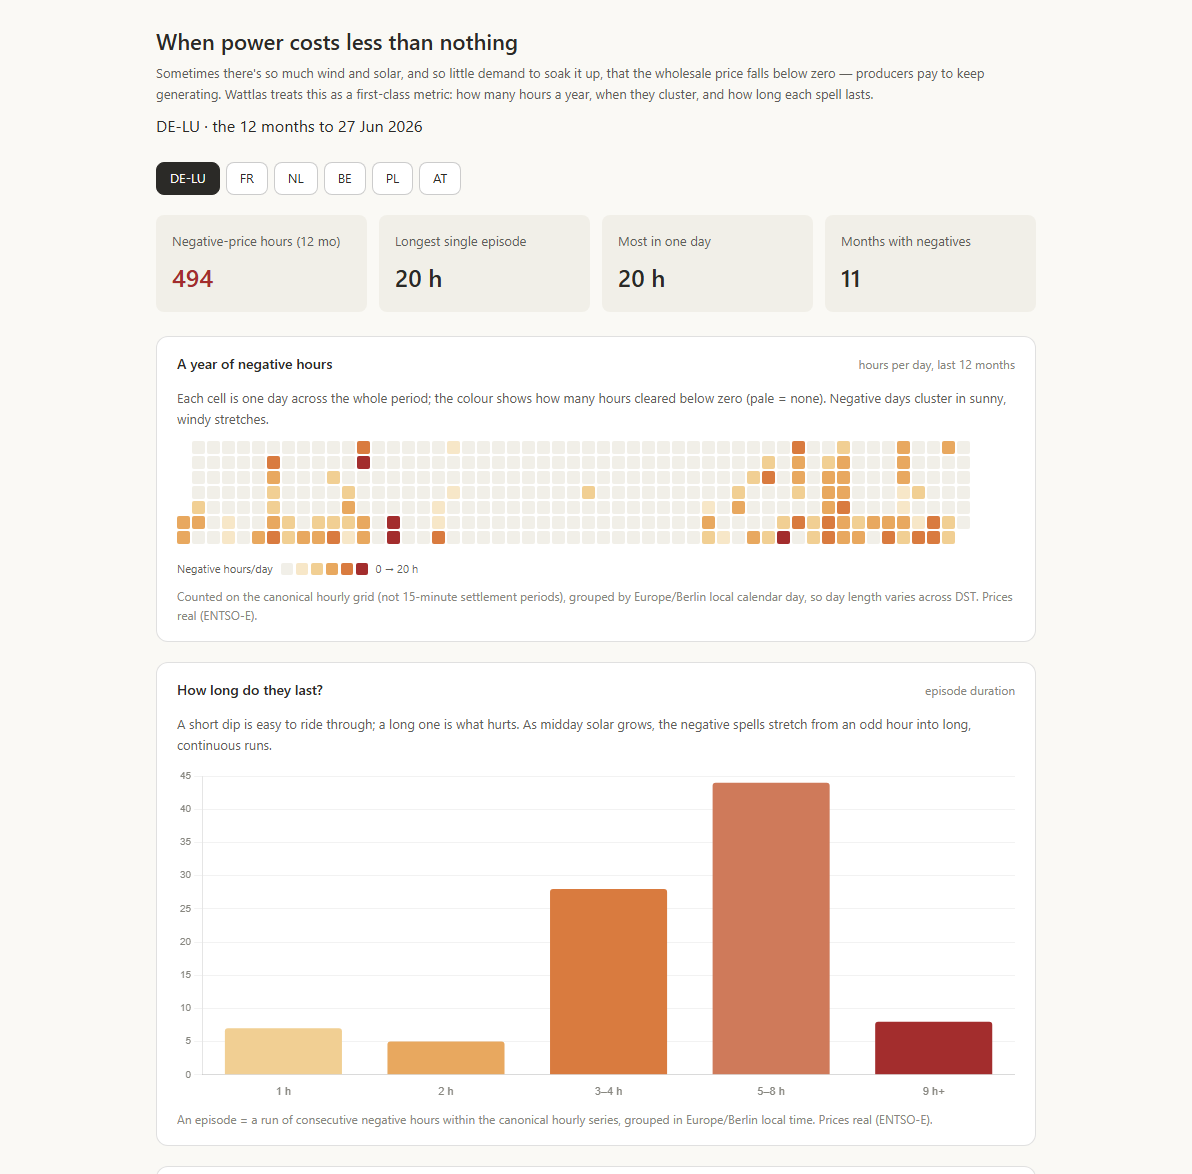
Chart · 4 of 5
Capture Price
What does a megawatt-hour of solar or wind actually earn?
Generation-weighted capture price ÷ baseload = the value factor. German solar captures only ~0.55× the average price, because it is worth least exactly when there is most of it — cannibalization, computed from real data with the anchors cited, not assumed.
0.55×DE solar value factor
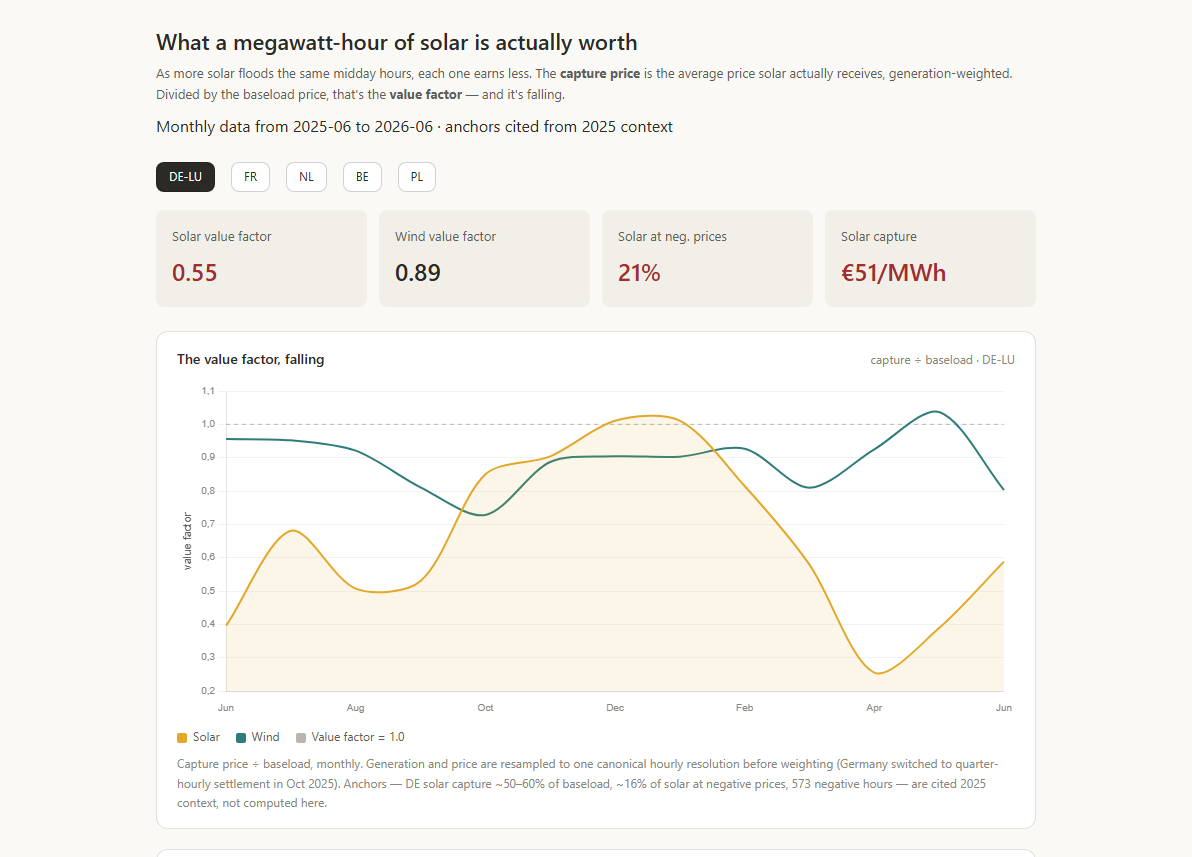
Chart · 5 of 5
History
Is the daily spread widening over the years?
Three years of daily spread, free to roam — zoom into a week, fold the series onto a seasonal curve, and read the longer-run trend. The volatility that storage and flexible demand are racing to monetise, laid out in one long series.
3 yrof daily data
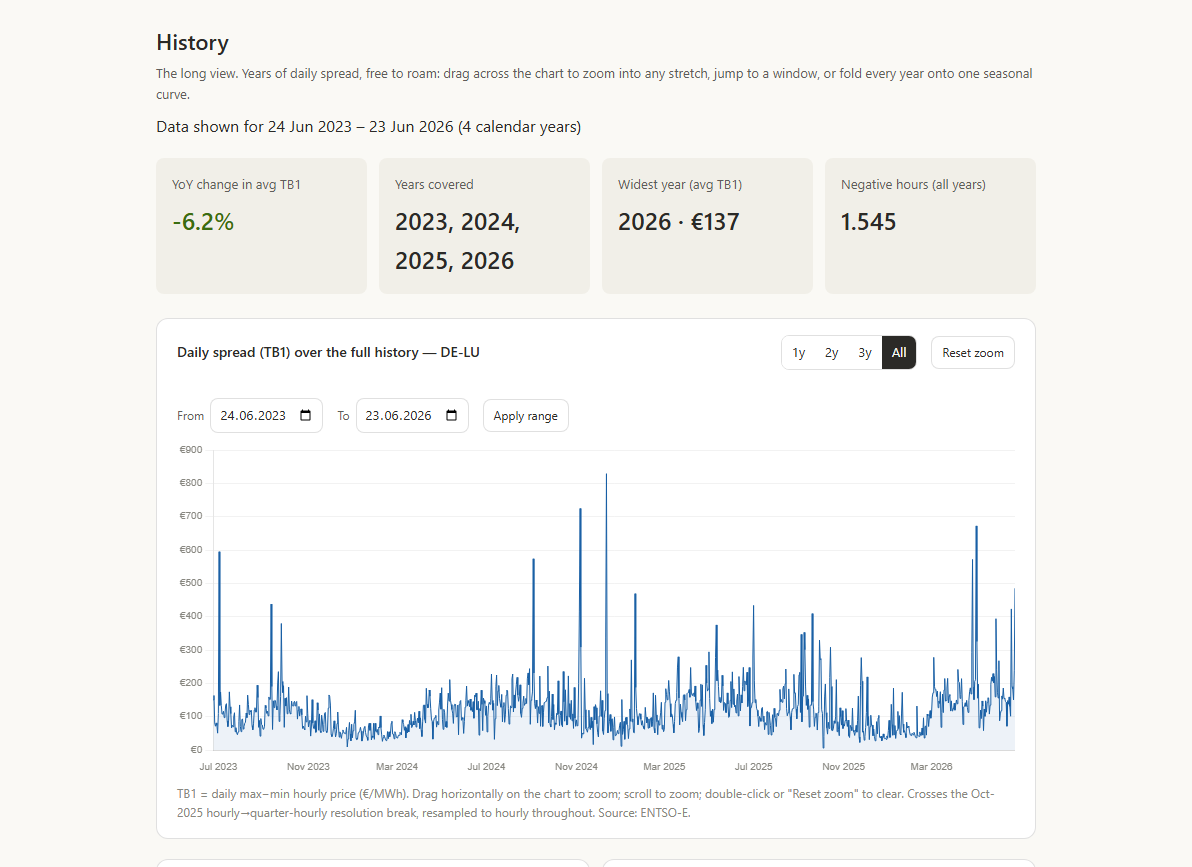
Chart · 1 of 4
Generation Mix
What actually generates the power, and how do countries differ?
Full generation by fuel for any zone, two side by side — France's flat nuclear baseload against Germany's volatile wind and solar. Gaps in the upstream data render as gaps, never fabricated zeros, and the fuel palette is identical in every view.
2-zoneside-by-side compare
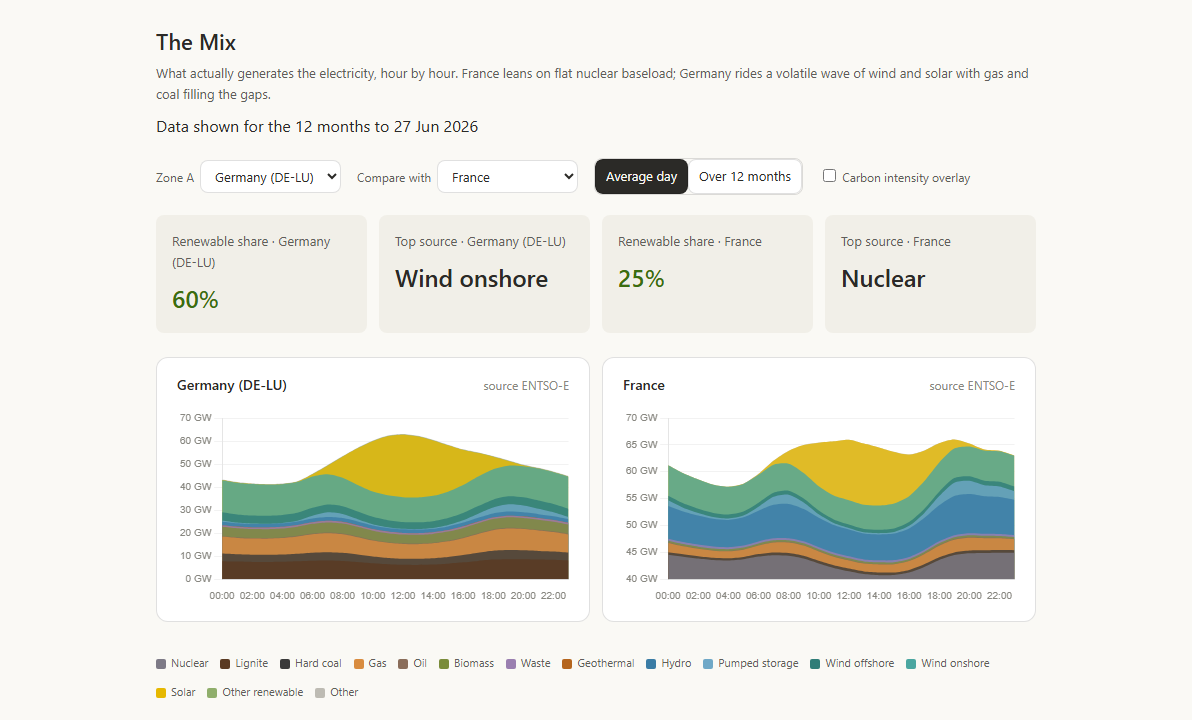
Chart · 2 of 4
Carbon Intensity
How clean is each hour of the grid?
Production-based carbon intensity computed from the live mix — from ~30 gCO₂/kWh on a renewable-heavy French hour to ~550 on a coal-heavy Polish one. Low when wind and solar peak, high when fossil plant sets the margin. The lifecycle methodology is stated, not buried.
30 → 550gCO₂/kWh, FR vs PL
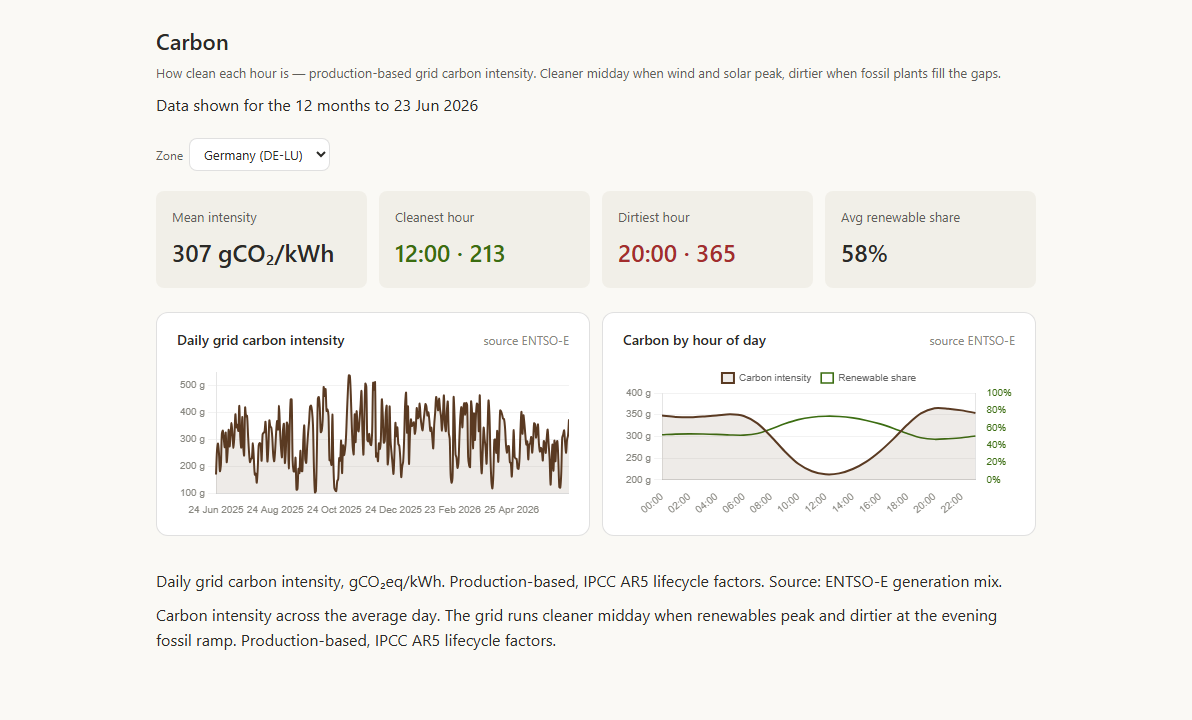
Chart · 3 of 4
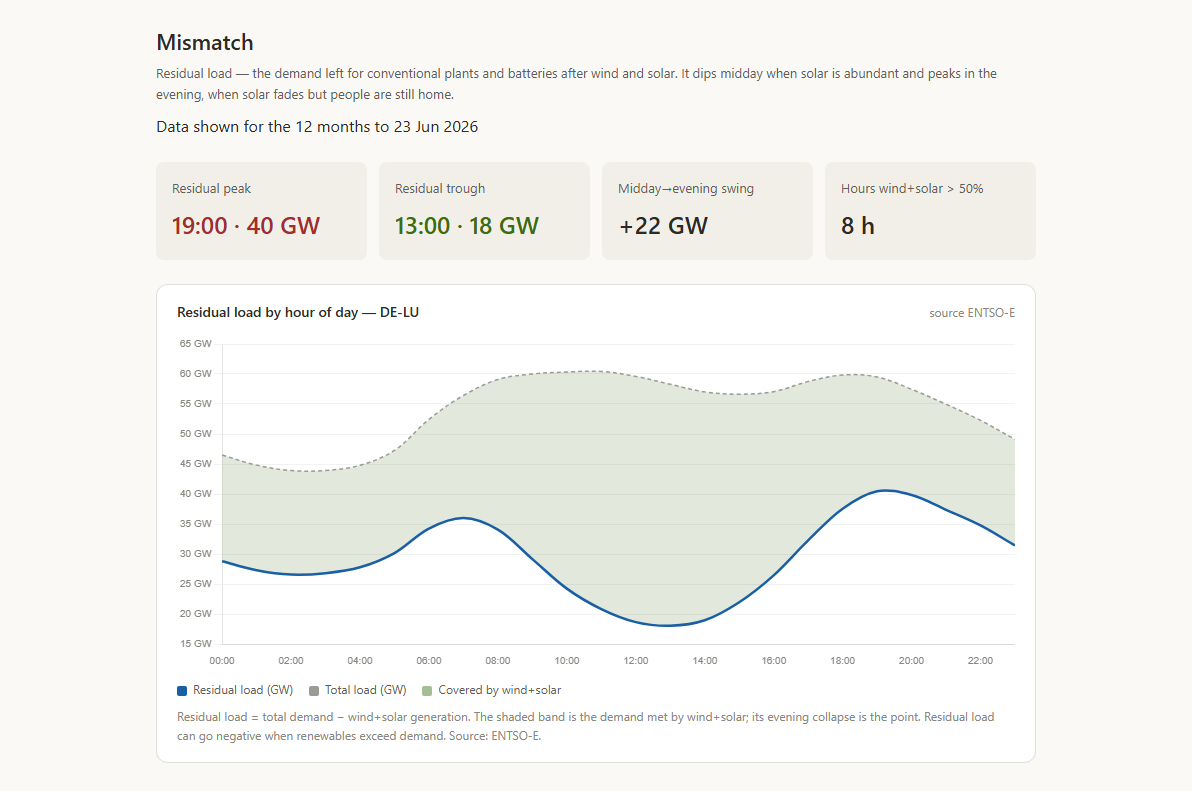
Residual Load
How much load is left once wind and solar have run?
Demand minus wind and solar — the residual that dispatchable plant and batteries must still cover. It peaks in the evening, when solar has gone but demand hasn't: the gap a weather-dependent grid has to plan around, hour by hour and zone by zone.
eveningpeak residual hour
Model · 4 of 4
Marginal Fuel
Why is the price what it is?
A model, not a measurement: modelled CCGT marginal cost against the day-ahead price shows gas setting it on roughly 77% of days. The gas input is a labelled proxy and the inference is flagged as a model — the view never claims to have measured the marginal unit directly.
~77%of days gas is marginal
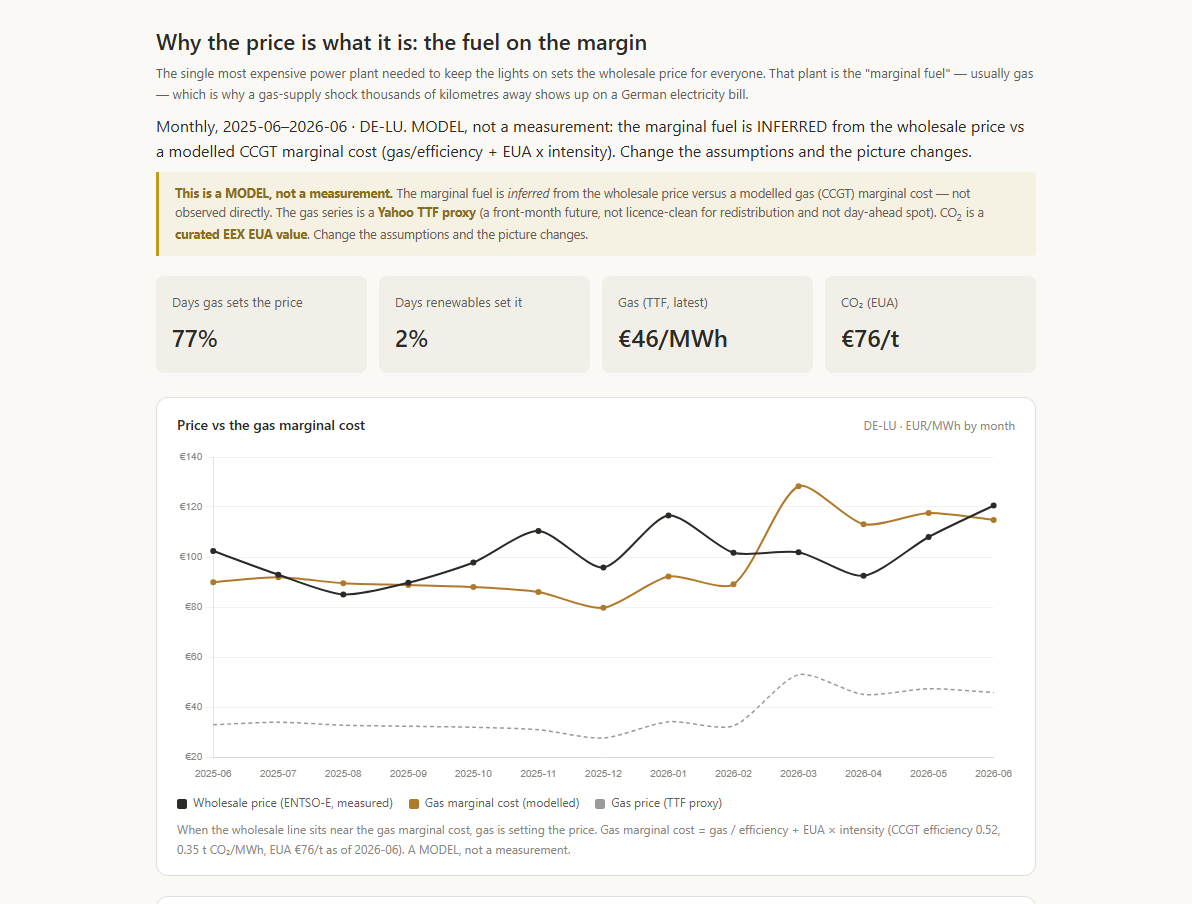
Chart · 1 of 7
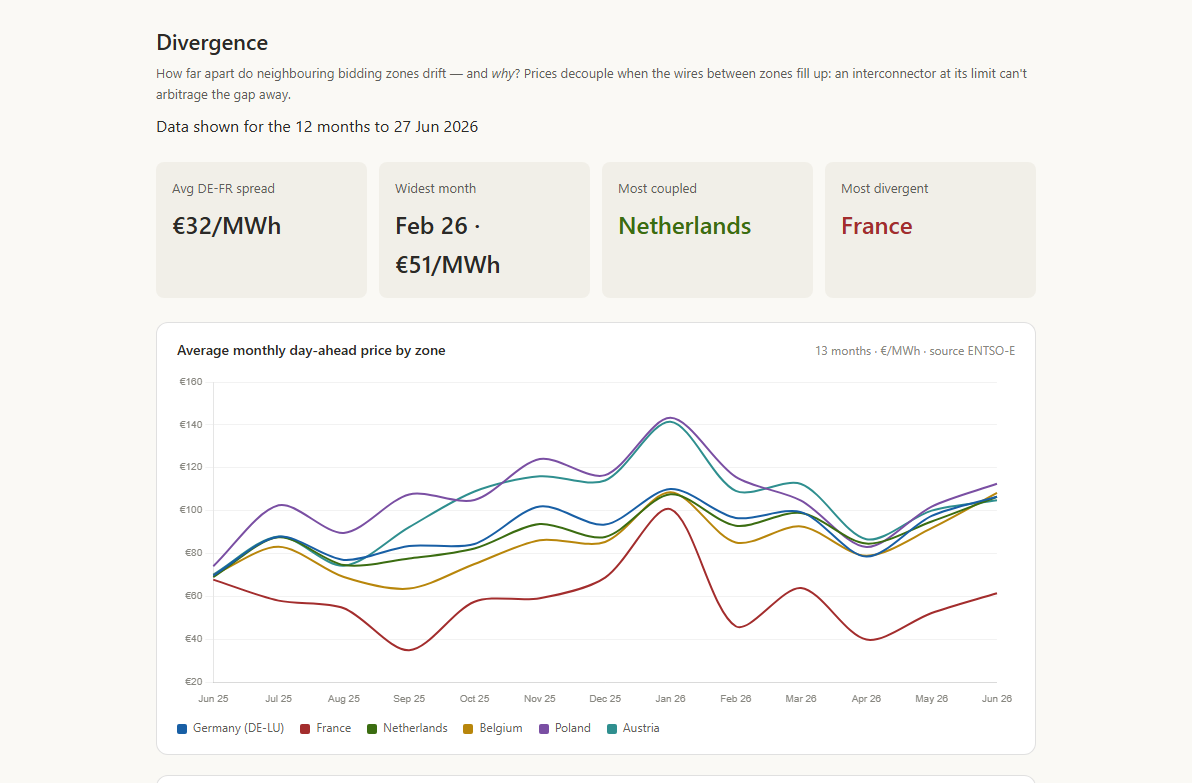
Divergence
How far do neighbouring zones' prices drift apart, and why?
Monthly price gaps between adjacent zones, alongside the physical cross-border flow that explains them, with congestion flagged. The headline is DE↔FR: when the interconnector saturates, one price becomes two.
DE↔FRthe headline price gap
Map · 2 of 7
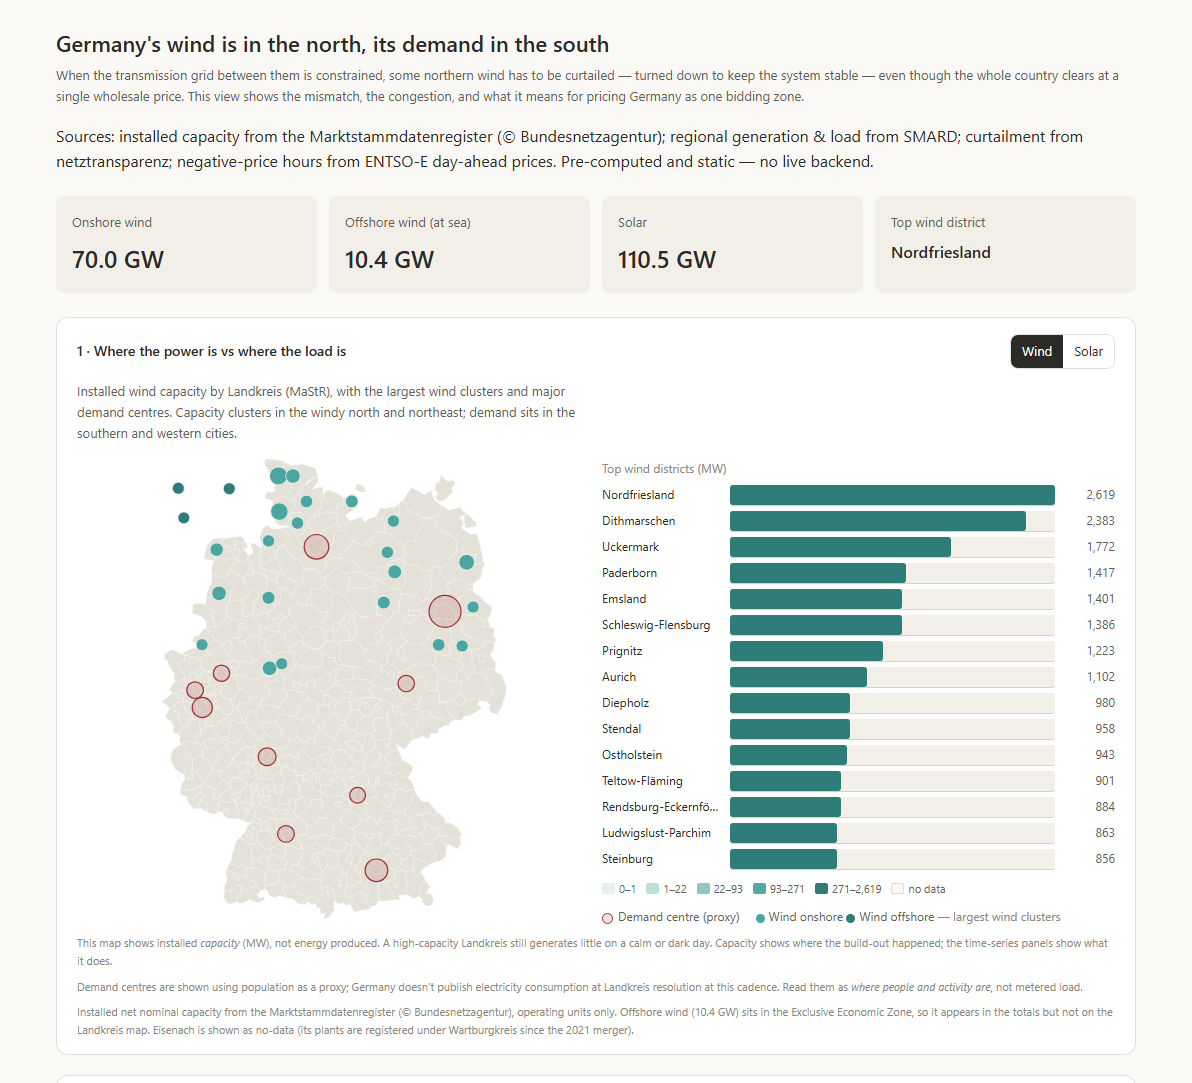
Germany North–South
Why is northern wind stranded from the demand down south?
Wind in the windy north, industry in the south, one price between them — so clean power gets curtailed and the grid pays to reroute it. ~400 Landkreise mapped by installed capacity, the control-area balance, and the single-zone debate laid out even-handedly.
~400Landkreise mapped
Map · 3 of 7
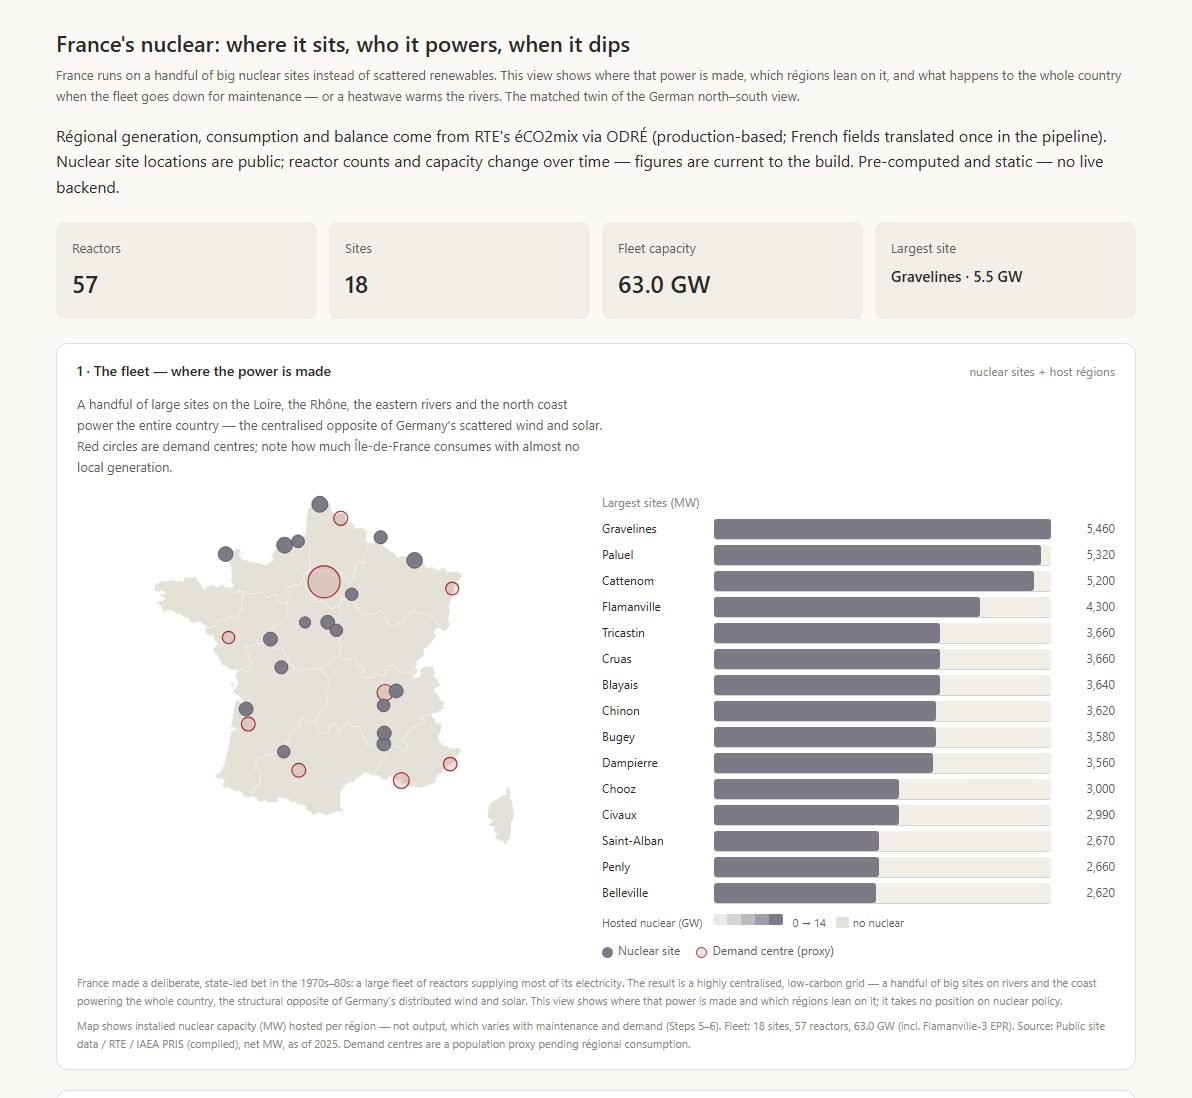
France Nuclear
Where does France's centralised fleet sit, and when does it dip?
The centralised mirror of the German story: ~63 GW across ~18 sites and 57 reactors, mapped by région, with the spring/summer maintenance dip, who exports and who imports, and the declared availability ceiling drawn over actual output.
~63 GWnuclear fleet, ~18 sites
Map · 4 of 7
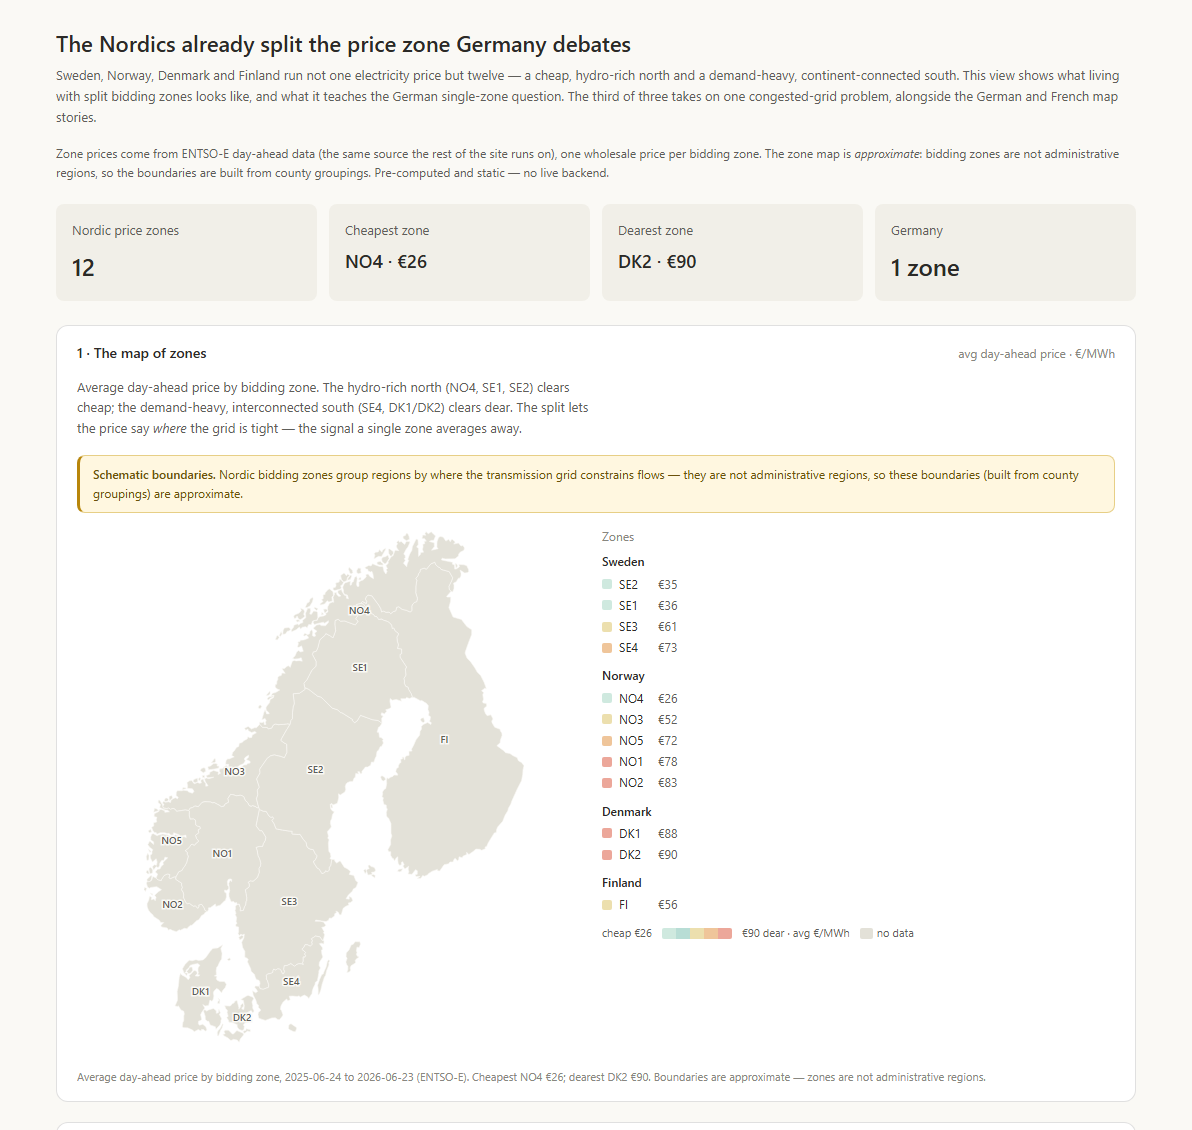
Nordic Price Zones
What does the split-zone market Germany debates actually look like?
The split Germany argues about, already running: twelve zones from a cheap hydro north (~€26/MWh) to a dear, continent-coupled south (~€90). The within-country divergence, shaded on the map — the lesson next door.
12 zones€26 → €90/MWh
Map · 5 of 7
UK Regional
What does keeping one price across Britain cost?
Britain's answer to the same problem: keep one national price and pay Scottish wind around £2 bn a year to switch off when the grid can't carry it south. Carbon intensity region by region, and the constraint bill that one price hides.
£2 bn/yrconstraint payments
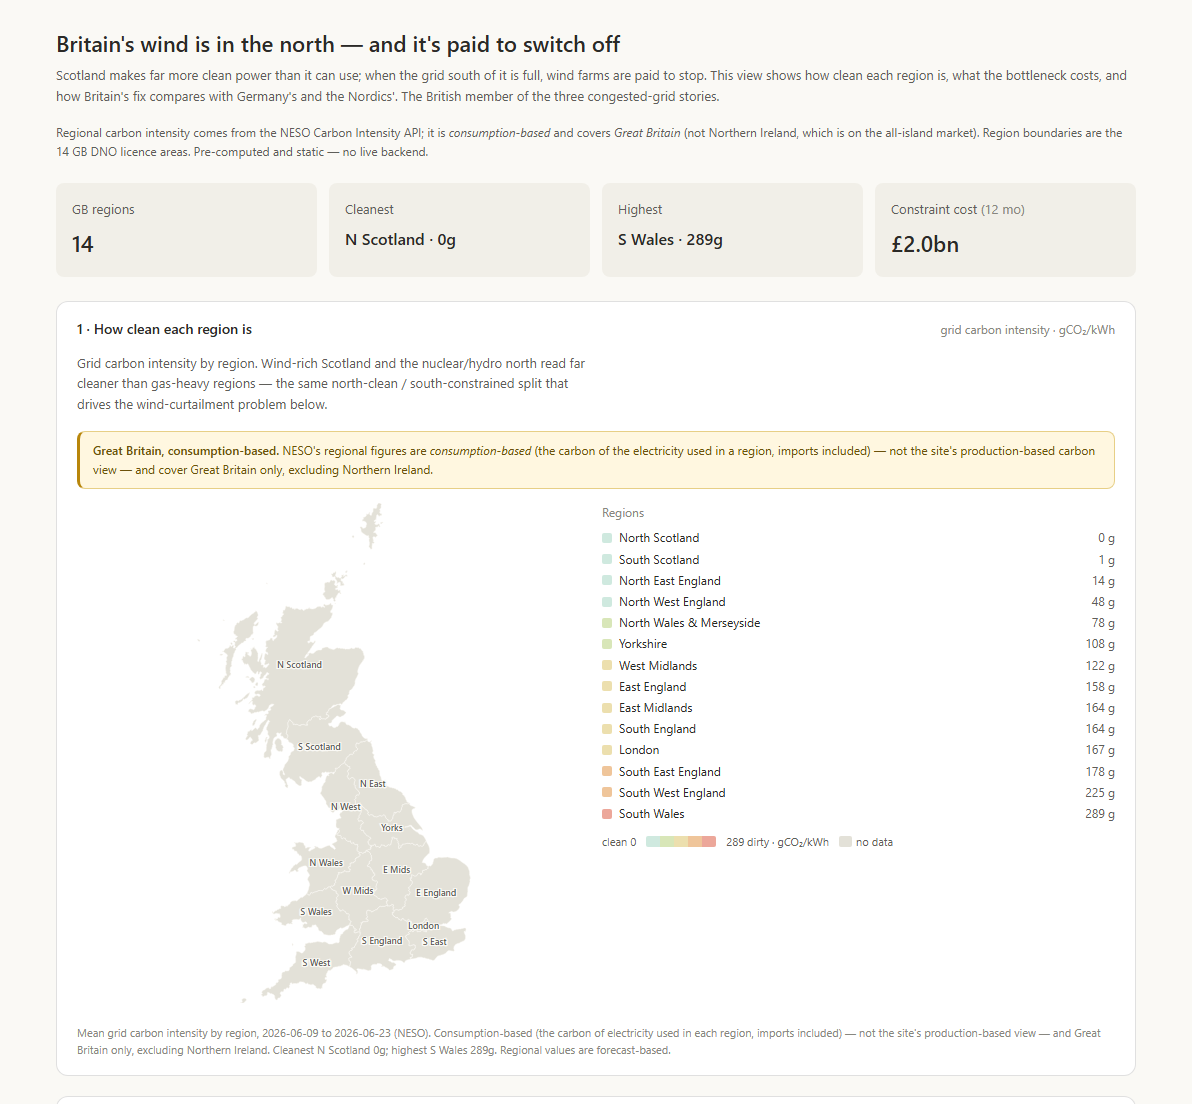
Chart · 6 of 7
Curtailment
How much clean power does the grid throw away — and why?
Curtailed renewable energy the grid couldn't move, spiking on stormy, negative-price hours — presented as a managed grid-stability measure, in MWh and €. Fails open to "awaiting source" if the upstream feed is down, rather than guessing.
stormy daysspikes on neg-price hours
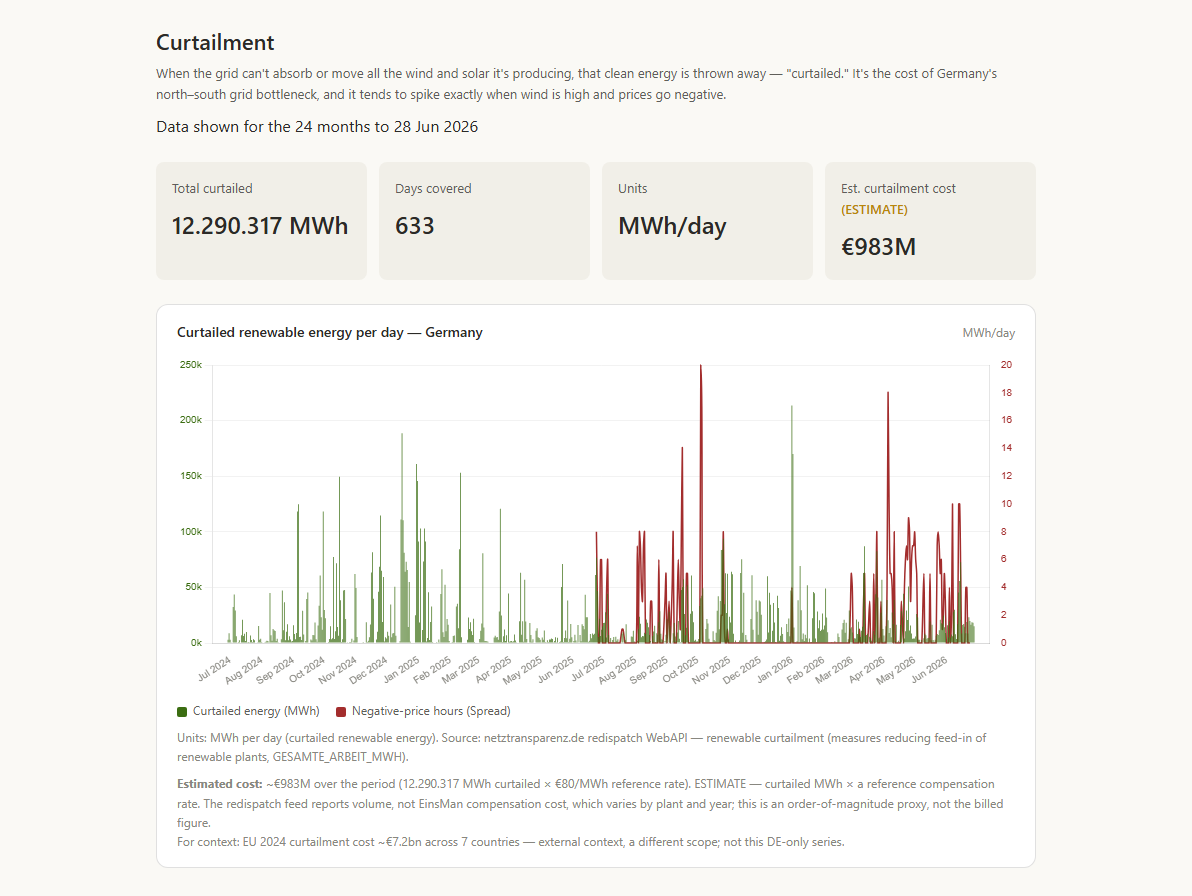
Chart · 7 of 7
Locational Signal
Why does the north–south split show in neither flows nor prices?
The bottleneck is internal to the single DE-LU bidding zone, so it is invisible to both cross-border flow and the one price. Shown as congestion evidence — with no simulated split price; the contested split-zone case is presented as a cited range, annotated, not asserted.
1 zoneDE-LU, debate annotated
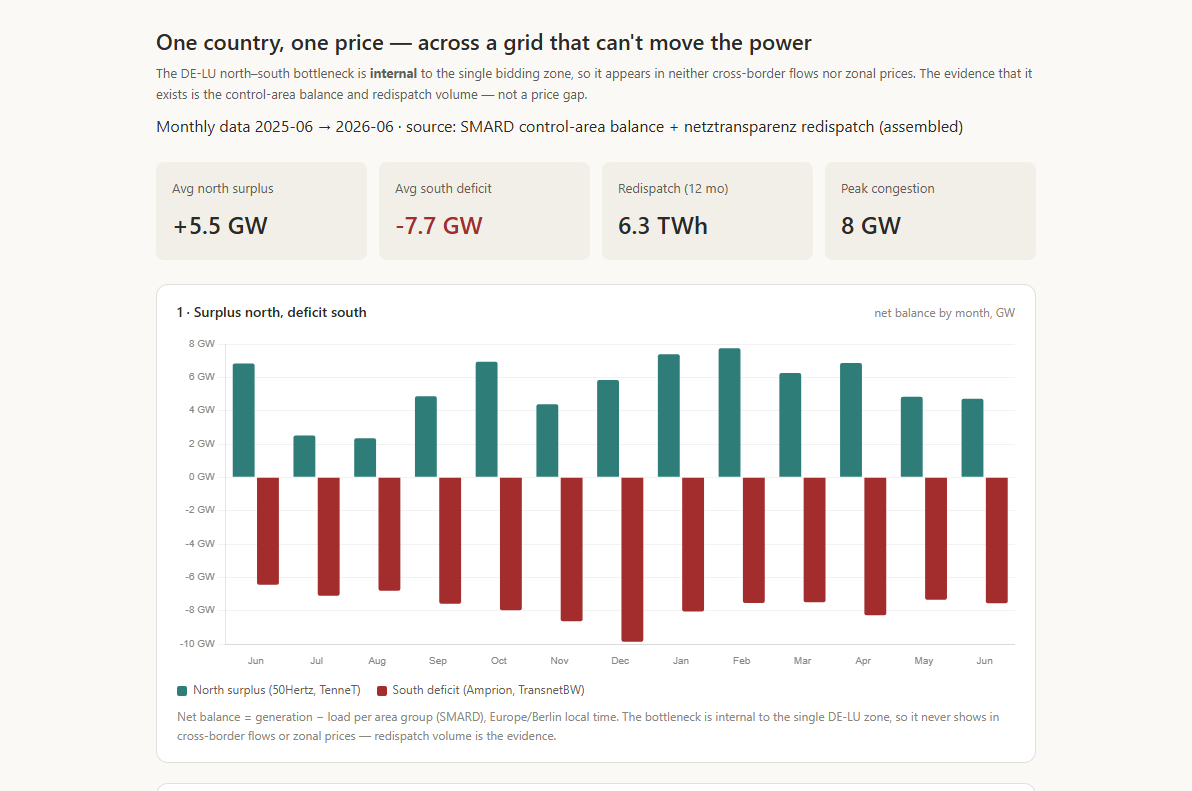
Chart · 1 of 4
Dunkelflaute
What happens when wind and solar vanish for days at a time?
The cold, dark, windless spells when renewables all but disappear — down to ~1.5% of demand in the worst November-2025 spell. It auto-detects the worst stretch, then shows the firm-power and import stack and the price climb the drought forces.
~1.5%renewables of demand, Nov '25
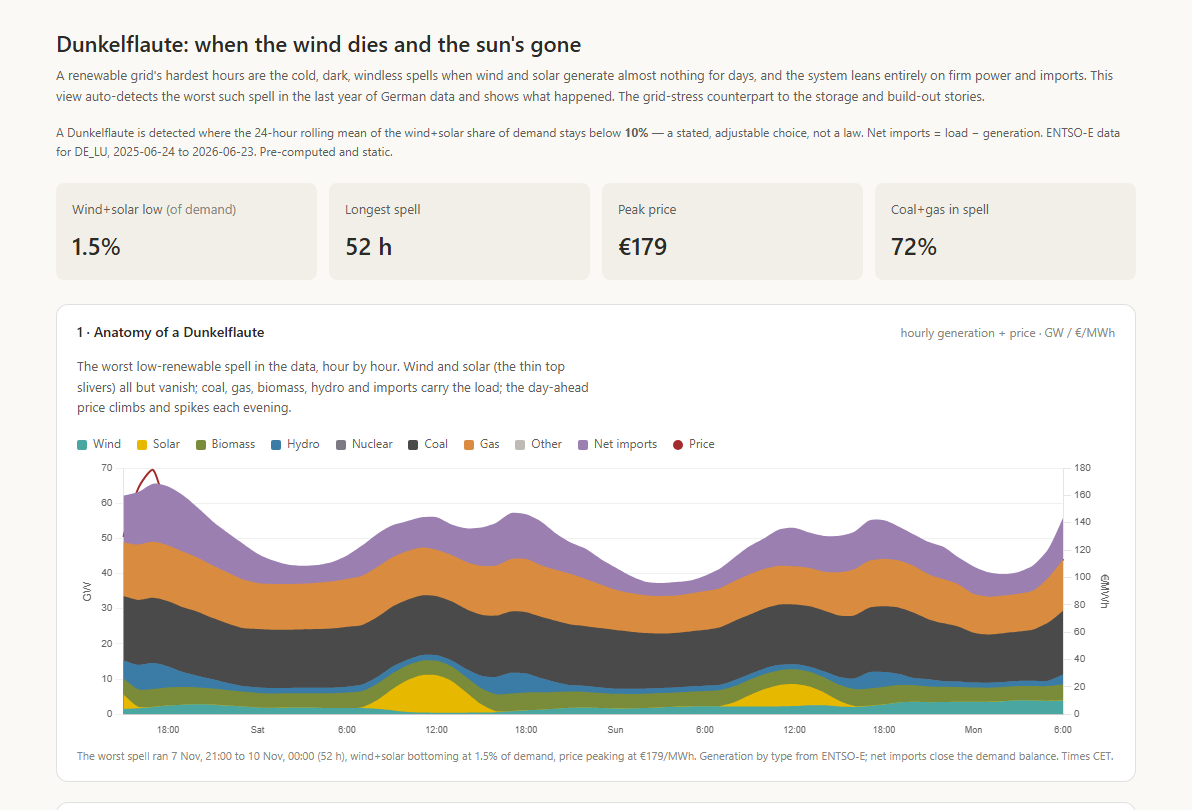
Chart · 2 of 4
Storage
Can a battery earn off the daily price swing?
The batteries that live off the spread — charging cheap at midday, discharging into the evening peak. A transparent arbitrage model labelled an upper bound, alongside where grid storage is actually being built (~6× the capacity since 2021).
~6×grid storage since 2021
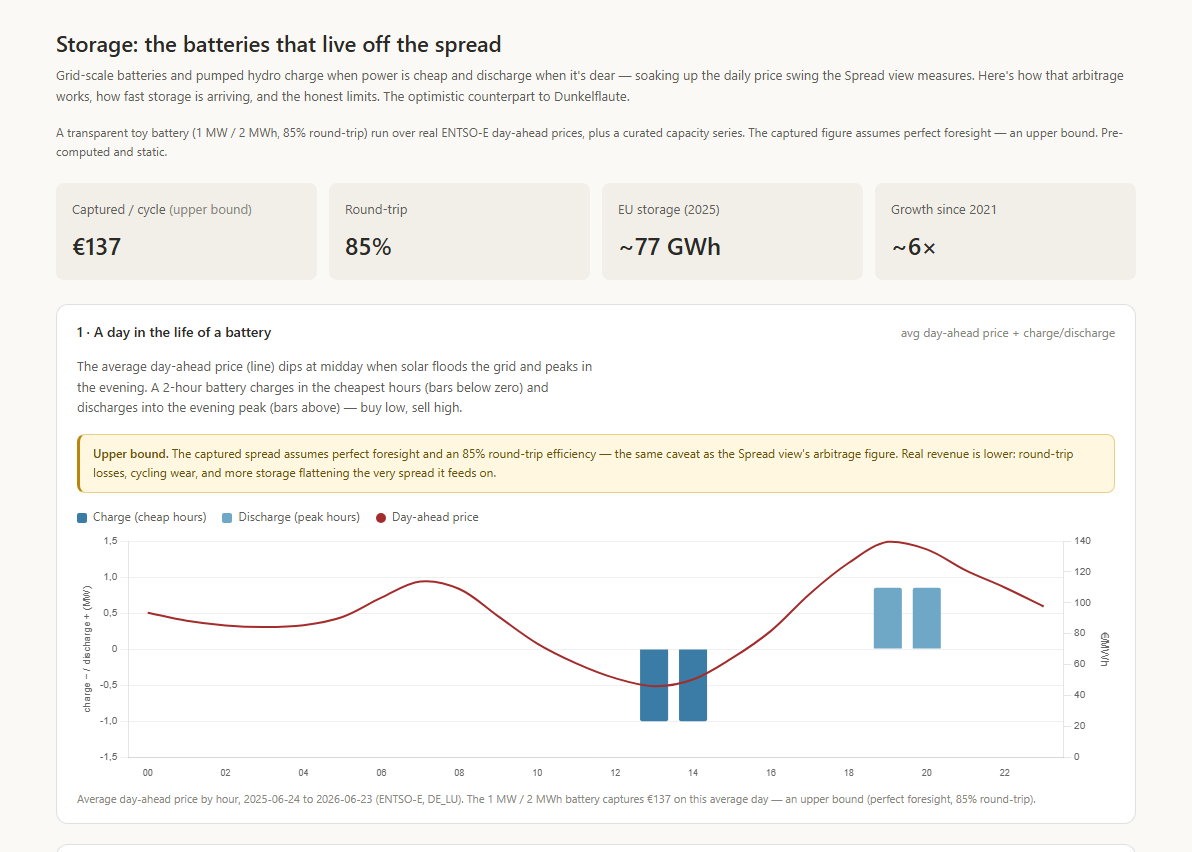
Chart · 3 of 4
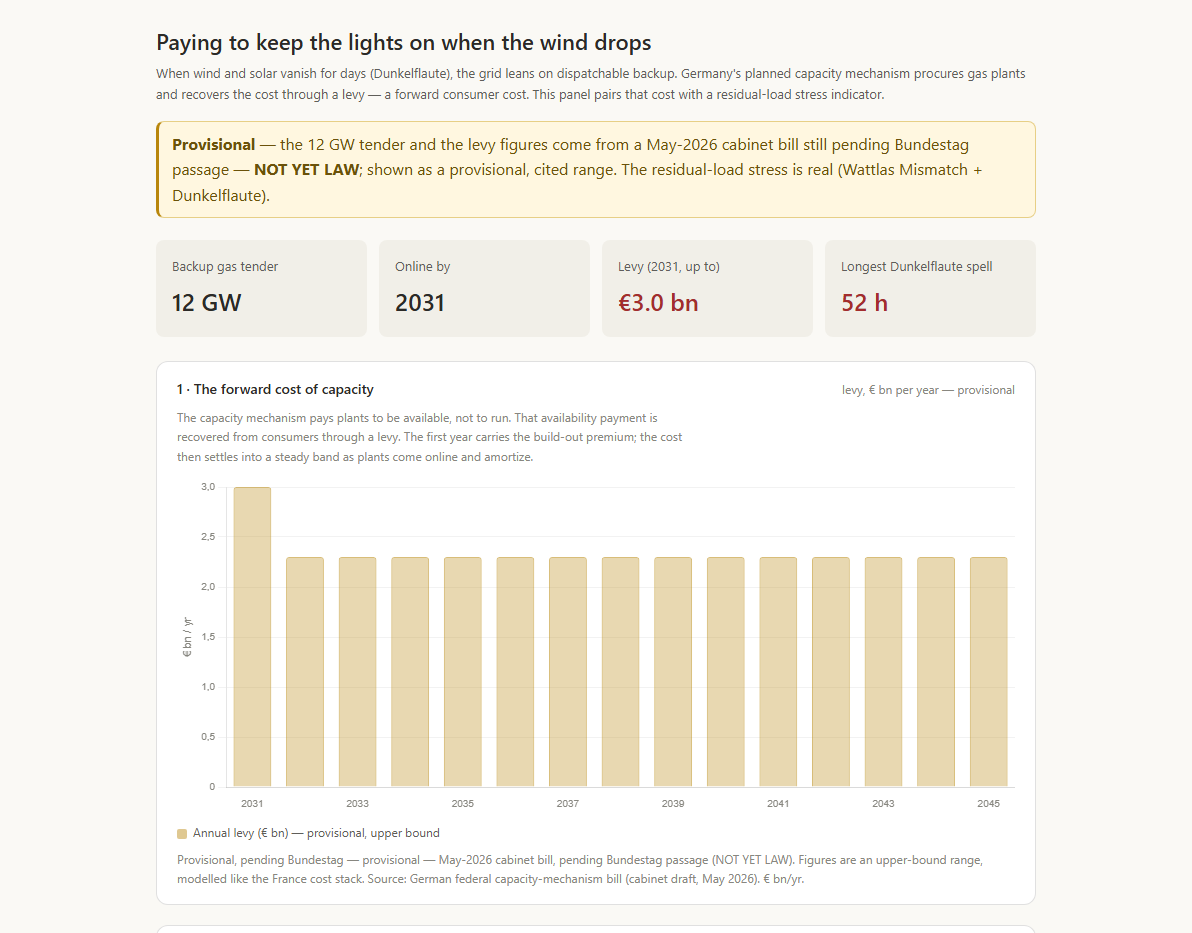
Capacity & Adequacy
Can firm capacity cover the worst hours — and what does ensuring it cost?
Whether dependable capacity can meet the toughest residual-load hours, and the policy written to guarantee it — Germany's provisional ~12 GW gas tender. The adequacy question a weather-dependent grid can't dodge, with its price tag flagged as provisional.
12 GWgas tender, provisional
Historical · 4 of 4
Iberian Blackout
How does a national grid go dark within seconds, and come back?
28 April 2025, replayed from the record: Portuguese load to the floor (~0.1 GW), then the sourced, hour-by-hour restoration. A deliberately sober account that cites the official ENTSO-E investigation and asserts no cause of its own.
~0.1 GWPT load at the floor
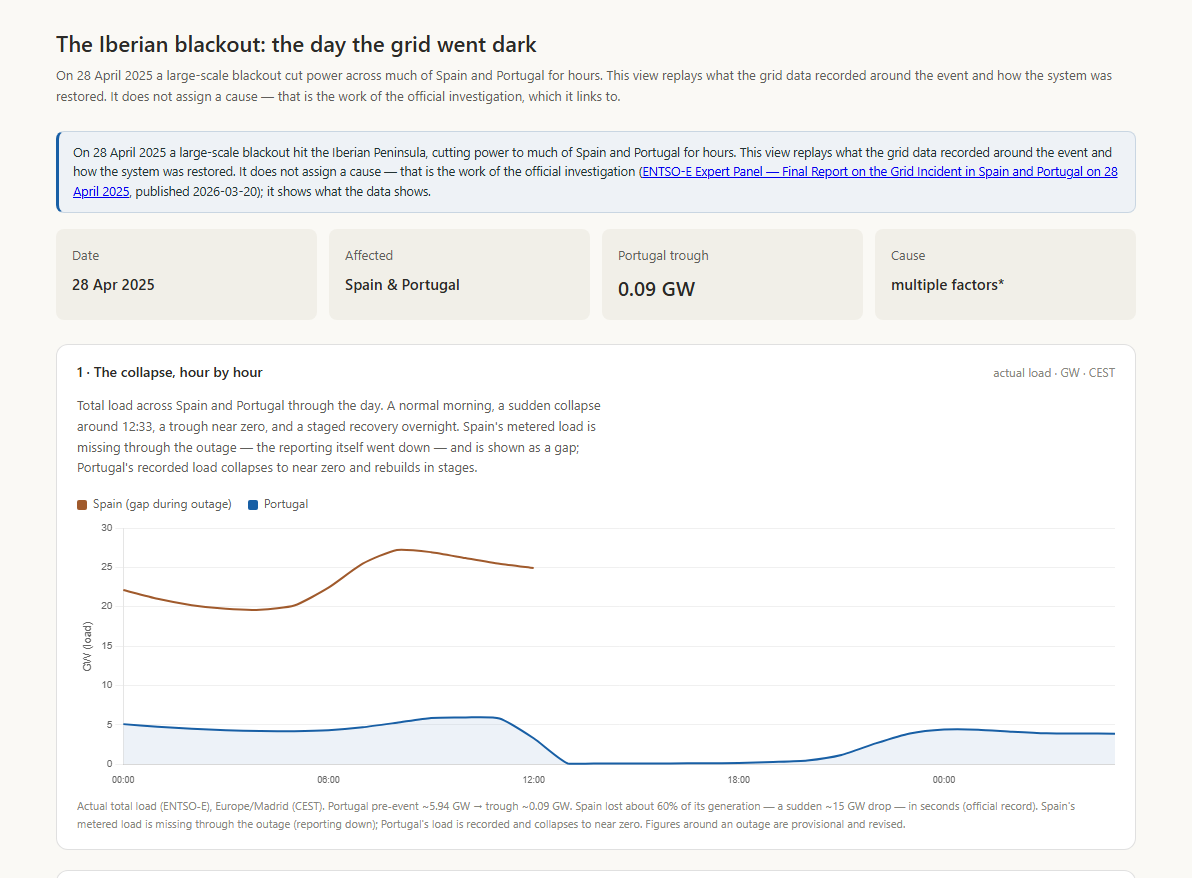
Chart · 1 of 4
Flexibility
What does shifting load to the cheapest hours save?
What a shiftable load — an EV, a heat pump, a home battery — saves over a year by charging in the cheapest hours instead of on a flat tariff. A labelled upper bound (perfect foresight, no losses), framed as the ceiling on the prize, not a guaranteed cut to your bill.
upper bound€/yr vs flat tariff
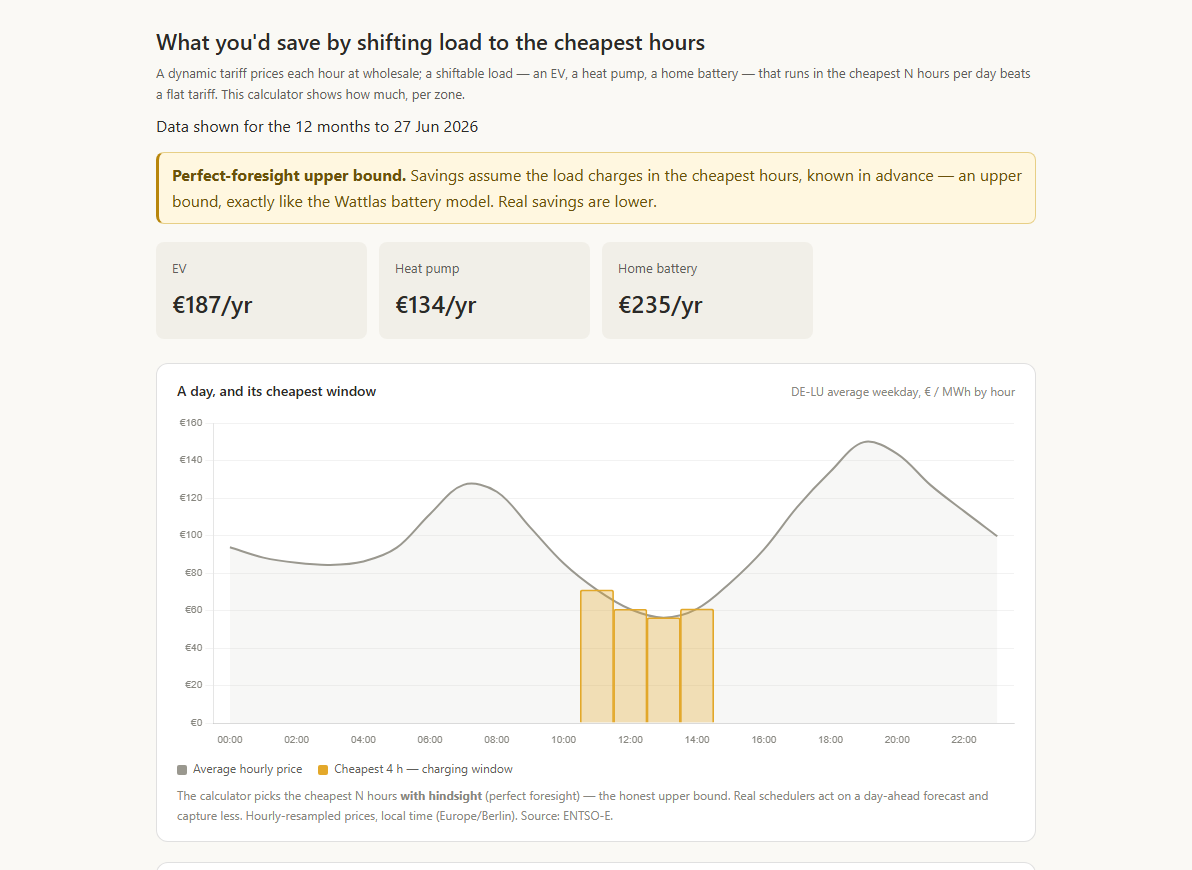
Chart · 2 of 4
Retail Wedge
What is actually in your electricity bill?
The wholesale price is a minority of it. Your bill split into energy & supply, network charges, and taxes & levies — Germany ~€0.39/kWh, only ~40% energy. Eurostat, annual, country-level, and how the wedge has shifted over time. Stated plainly: EUR/kWh ≠ our €/MWh.
3 partswholesale · grid · taxes
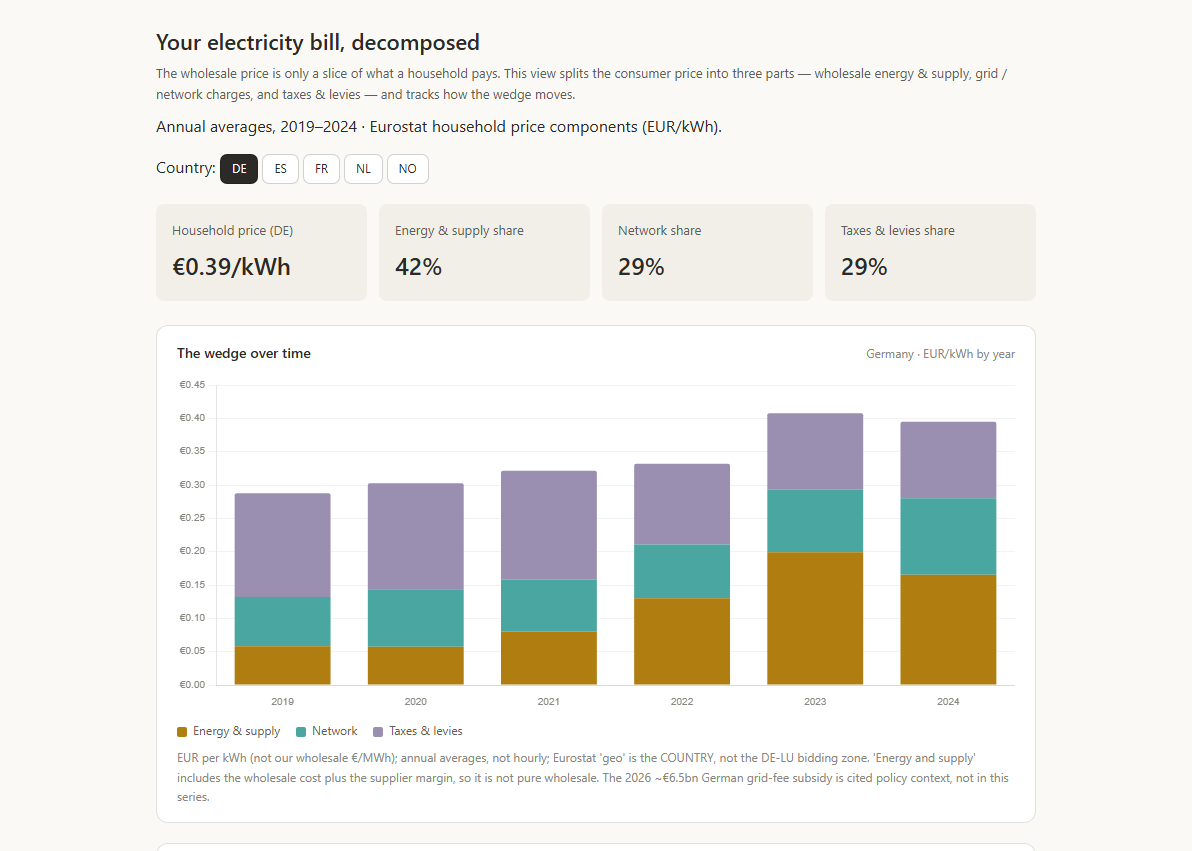
Chart · 3 of 4
Industrial Prices
What does heavy industry pay — and where does Wattlas stop?
Industrial electricity prices, Germany against France, Spain and Norway, country-level from Eurostat. Honestly bounded: it is a country-level comparison, not a plant-level one — and the view says exactly that rather than implying a precision the data can't carry.
DE vs FR/ES/NOEurostat, country-level
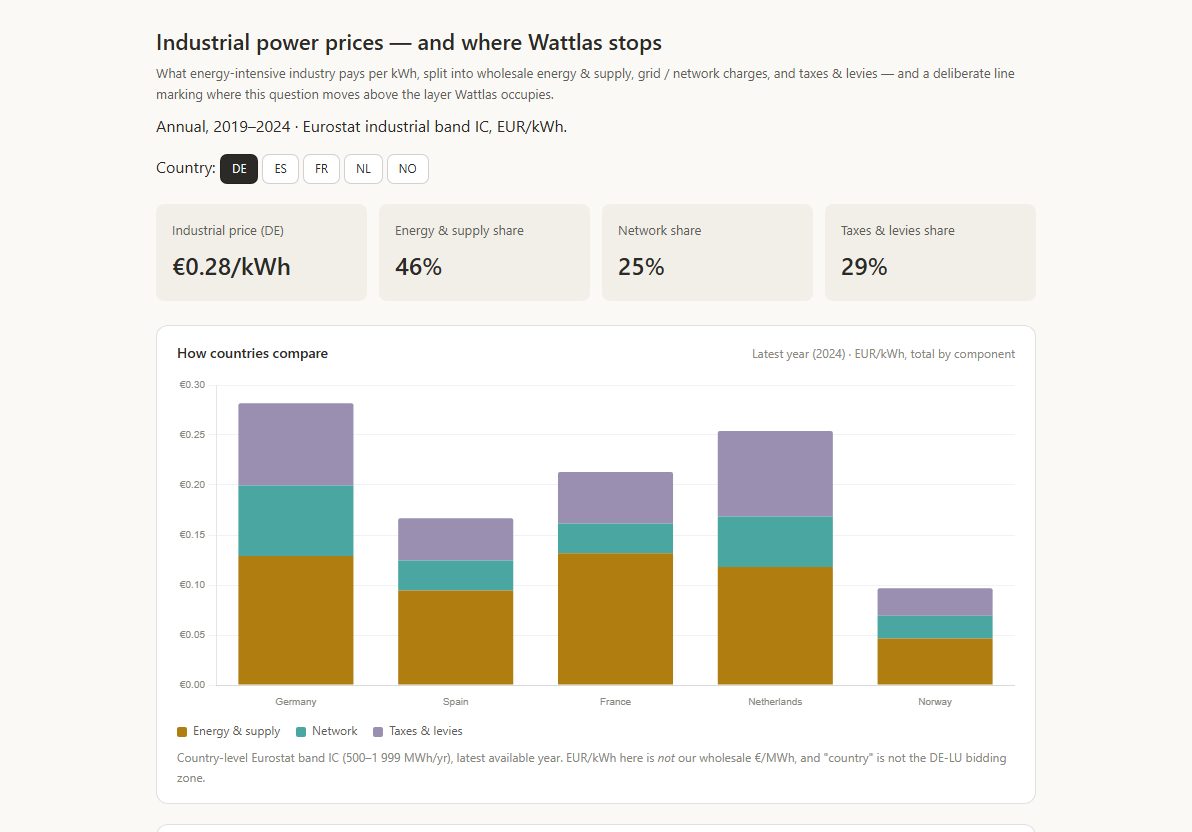
Chart · 4 of 4
Curtailment in €
What does thrown-away wind cost?
The price tag on curtailment: curtailed MWh × a reference rate, a running annual estimate — labelled an estimate, not the actual bill. The economic shadow of the north–south bottleneck, the same data from the Geography section taken one question further.
€ est.running annual total