Where does power flow, and why do prices split?
Geography of Price
One country, one price, until the grid can't carry the power across it. Germany, France, the Nordics and Britain are mapped here: four answers to the same bottleneck.
Ask about this section
- If the whole country pays one price, where does the shortage show up?
- Why is power cheaper in the north of Sweden and Norway than in the south?
- How much has Britain spent turning wind farms down, and when was it worst?
Divergence measured
How far the prices of neighbouring bidding zones drift apart, and the cross-border flow that explains it.
Why do two neighbouring countries pay different prices for the same hour? →Method: Monthly mean prices and the divergence, Cross-border flow and congestion.
Germany North–South Map view measured
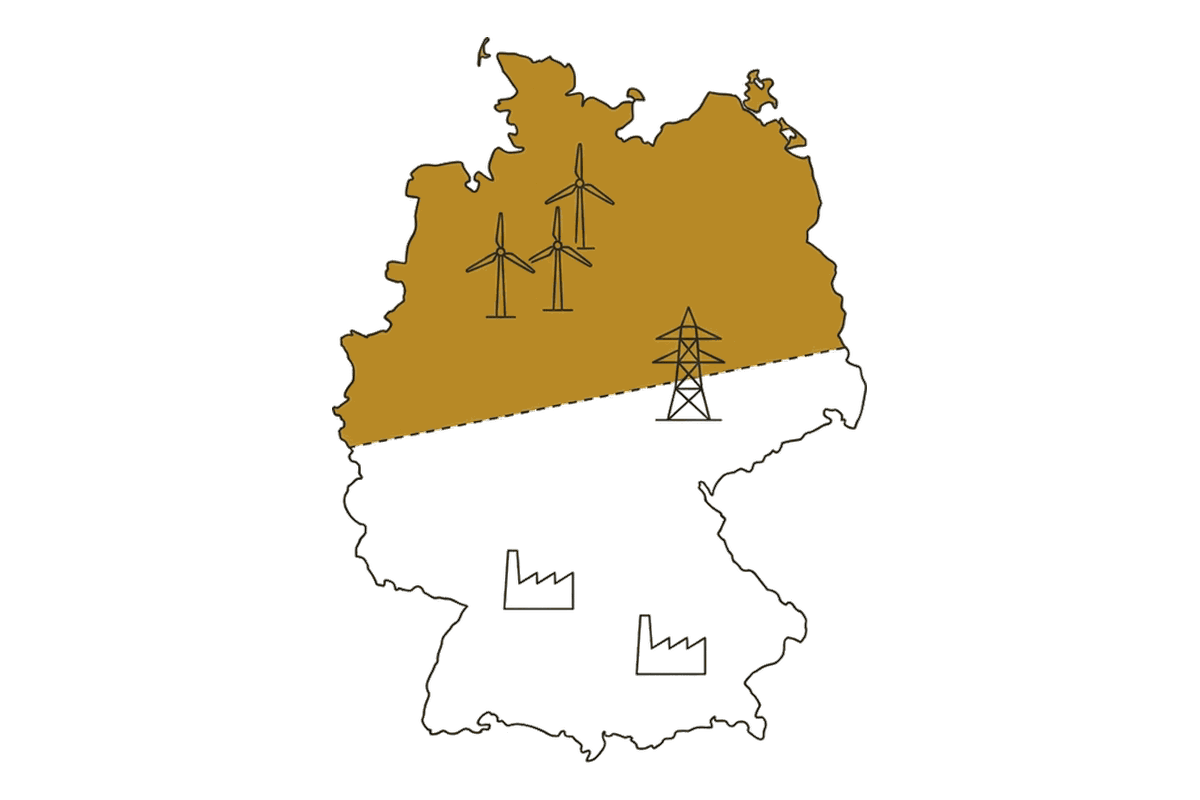
Wind in the north, demand in the south and one price between them, which is why wind farms get switched off (curtailed). Inside the view: Surplus north, deficit south · A day in each area.
Why does Germany's wind sit in the north while its industry sits in the south? →France Nuclear Map view measured
France: 57 reactors, the régions that export and import their power, and what it costs. Inside the view: Who exports, who imports · What does the power cost?
How much of French electricity comes out of the reactor fleet? →Method: The canonical hourly grid.
Nordic Price Zones Map view measured
The split Germany decided against, already live: 12 zones, a cheap hydro north, a dear south. Inside the view: How far prices diverge · The lesson for Germany.
What is a bidding zone, and why do the Nordics have so many of them? →UK Regional Map view measured
Britain keeps one price and pays Scottish wind to switch off. Inside the view: How clean each region is · Same problem, three fixes.
Why does Britain pay wind farms to stop generating? →Curtailment estimate
Renewable power switched off when the grid can't move it: the volume in MWh and an estimate of its cost in €.
Why would anyone switch off a wind farm that is generating for free? →The euro figure is an estimate at a reference rate; the settled cost differs by plant and year. Method: Curtailment cost at a reference price.
Locational Signal estimate
The north–south bottleneck Germany's single price hides, and both sides of the argument over splitting it. Inside the view: Redispatch volume · The split that was decided against.
What does a single national price hide about where power is scarce? →The split-zone effect is a cited range from published studies. Method: The north–south congestion index.