A field guide to European power markets
When, where and how much the price of electricity moves in Europe.
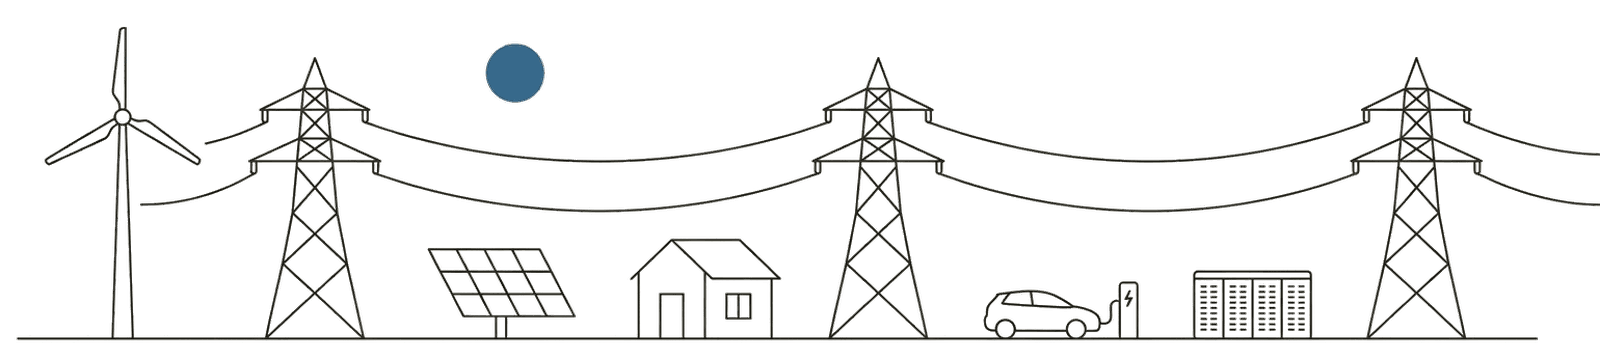
Prices went negative, the bill went up, wind farms were paid to switch off. Wattlas takes the open data behind those headlines, Germany first and then the rest of Europe, and turns it into 36 short views, one question each, sources on the page.
When does power move?
The Daily Rhythm
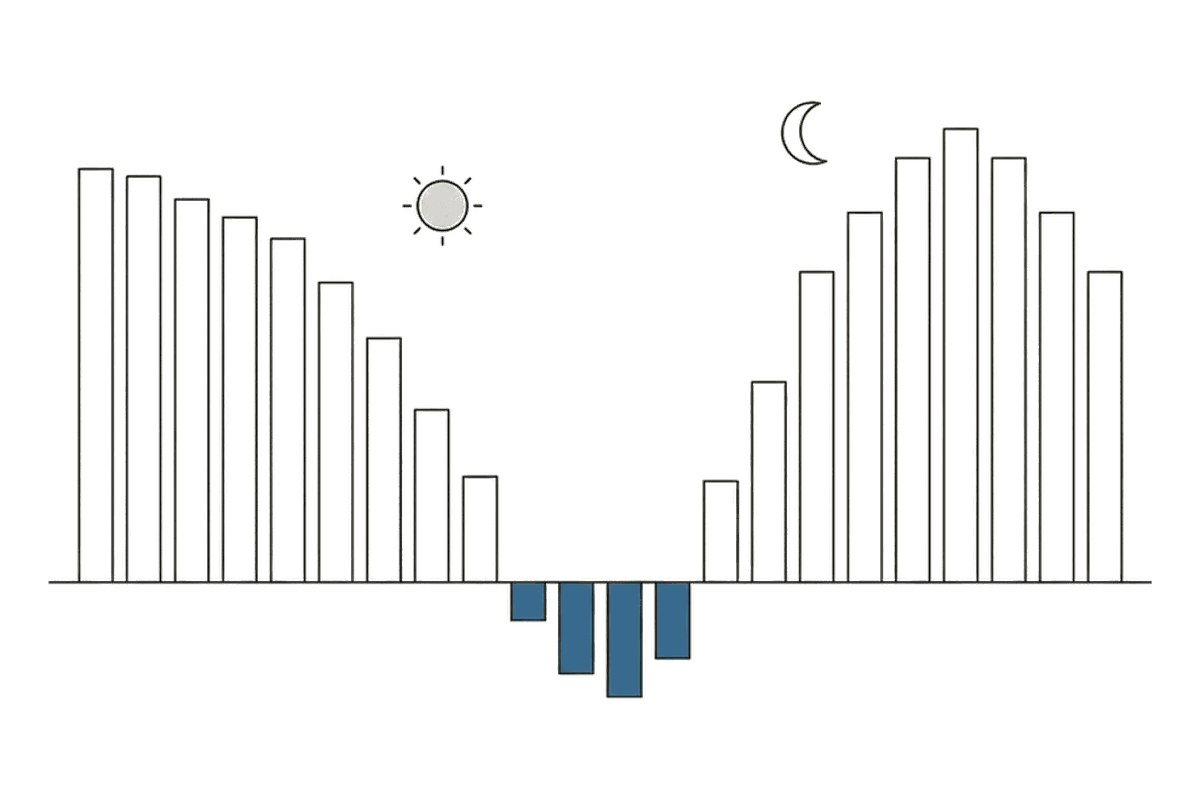
Electricity has no single price. It has a price every hour, and since October 2025 every quarter-hour. It swings between cheap and expensive, day to day and year to year.
Views in this section
What's flowing through the wires?
What's on the Grid
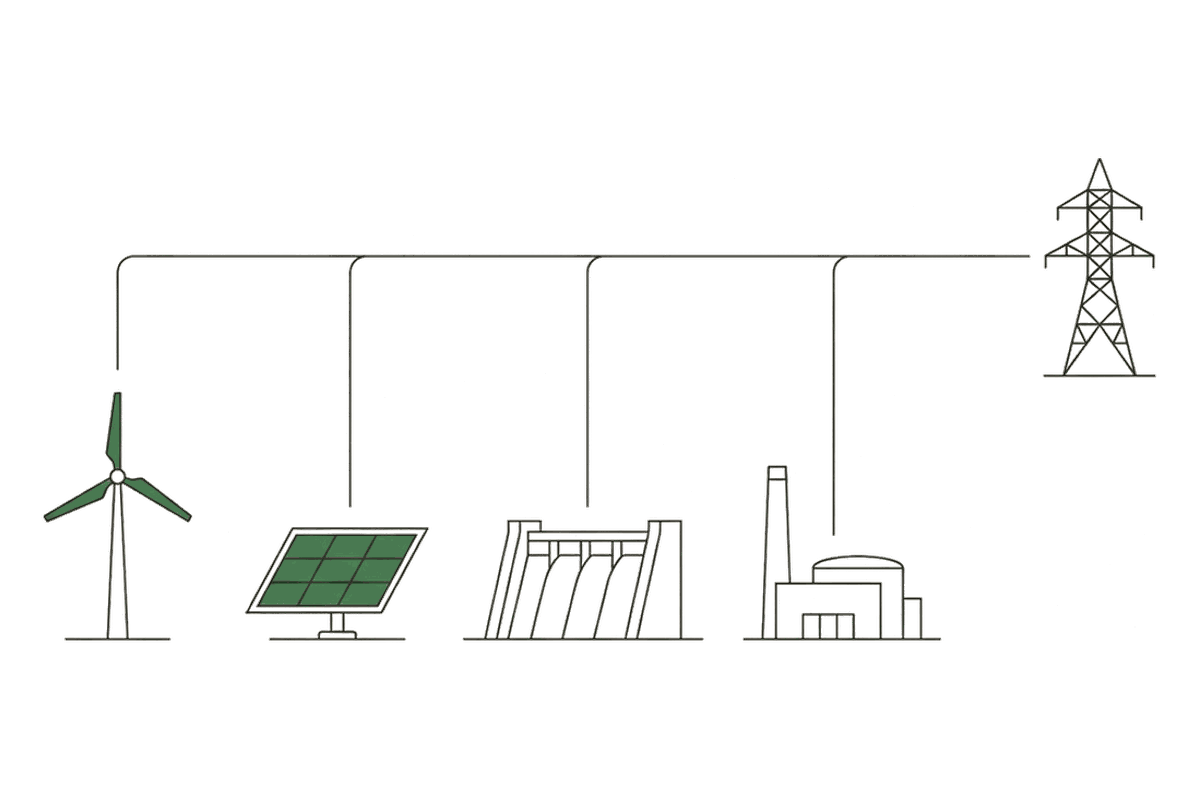
Behind every price is a physical mix of fuels. This is what generates Europe's power hour to hour, and how clean or dirty each hour is.
Views in this section
Where does power flow, and why do prices split?
Geography of Price
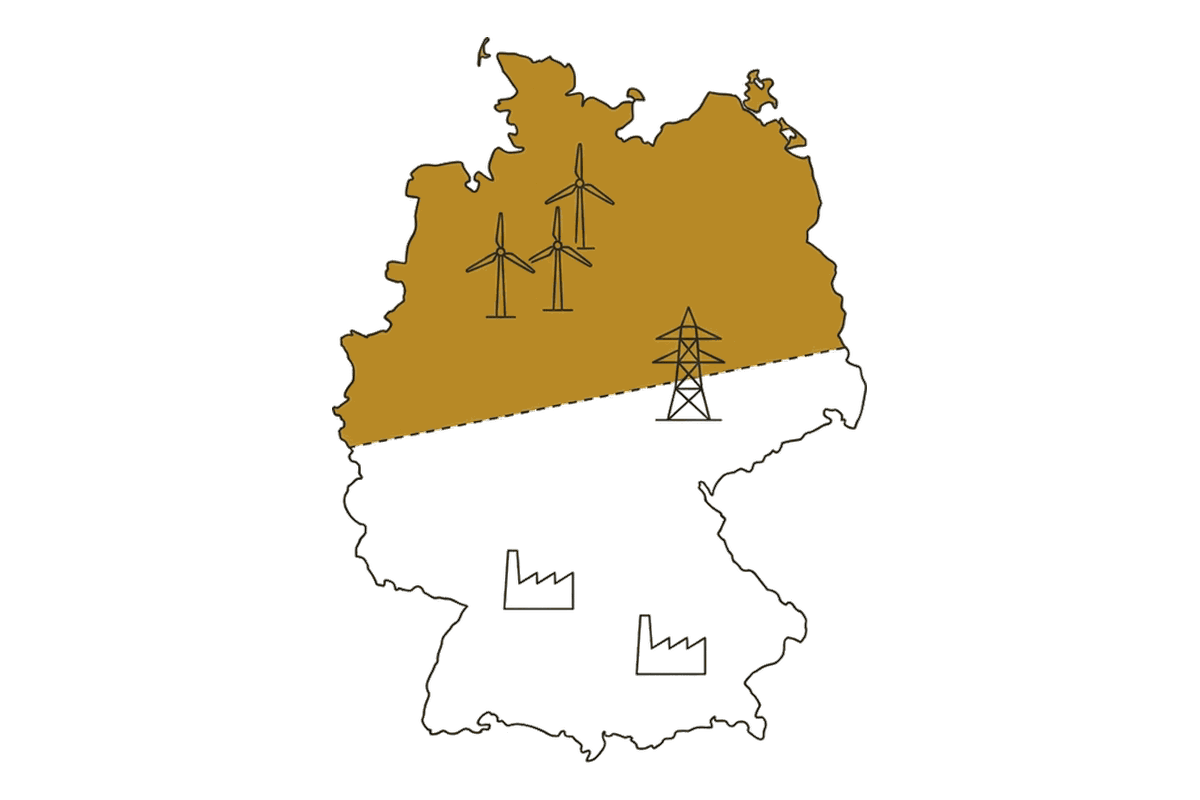
One country, one price, until the grid can't carry the power across it. Germany, France, the Nordics and Britain are mapped here: four answers to the same bottleneck.
Views in this section
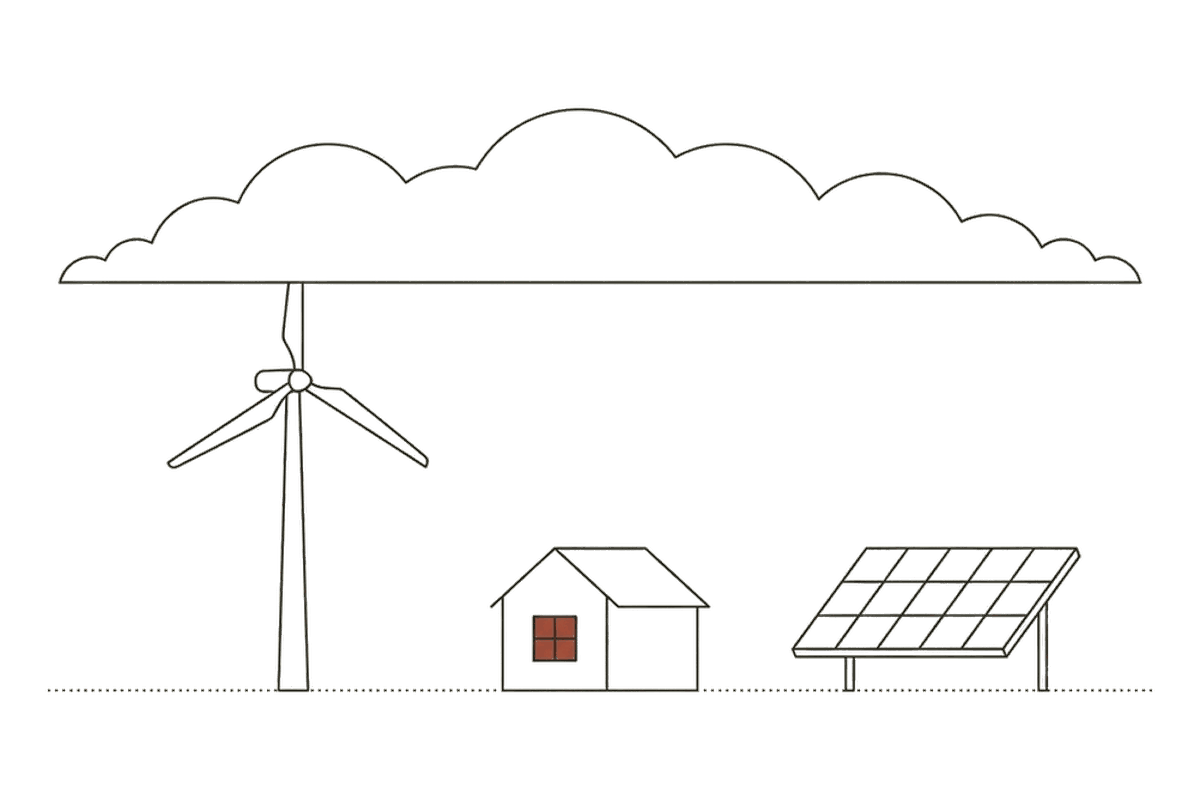
What happens when supply runs tight?
When the Grid Is Tested
A renewable grid's hardest hours: the windless, sunless spells it must plan for, the batteries that ride the gap, and whether there is enough capacity behind them when the gap runs long.
Views in this section
What does it cost, and who pays?
The Bill
The wholesale price is only the start of a bill. Network charges, levies and taxes come on top, and flexibility and curtailment have a price of their own.
Views in this section
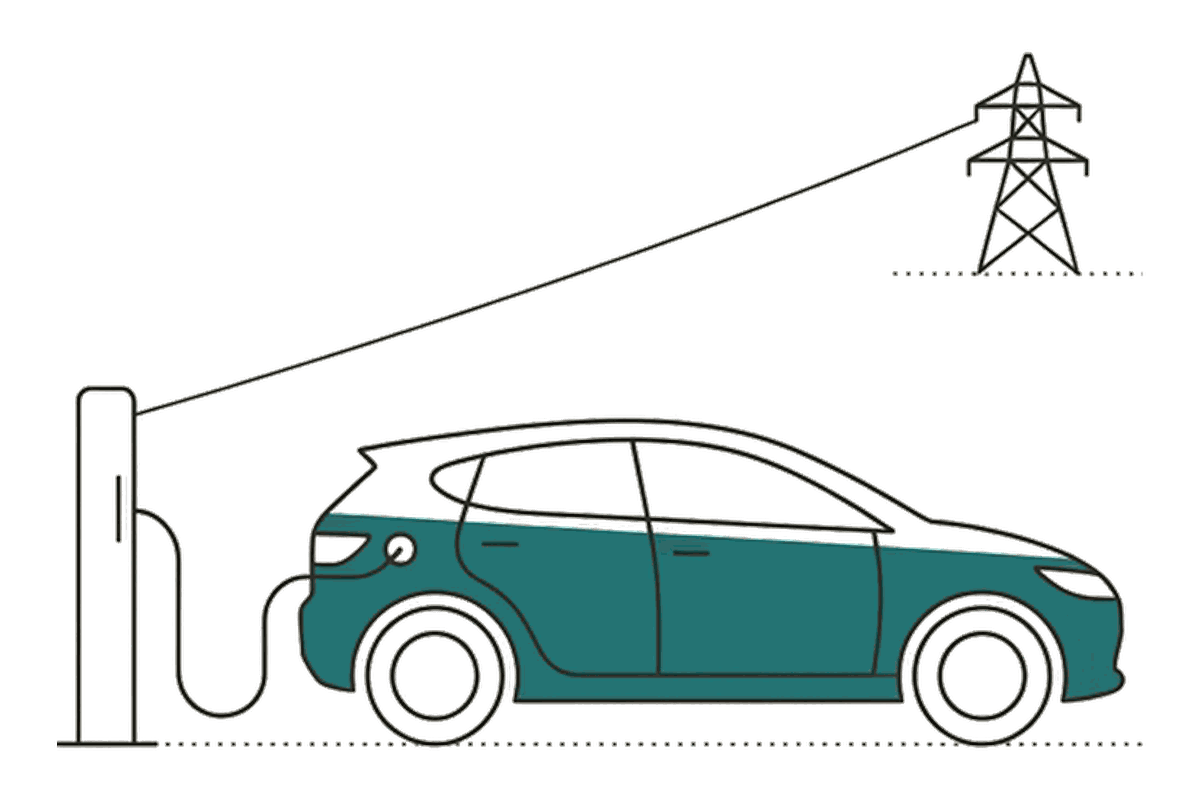
What's plugging into the grid?
The Charge
Millions of cars and the first electric lorries are a new load on the grid, and the first big one that can choose when it draws. Road transport's share of all the electricity Germany consumed: 1.25% in 2024. Where vehicles plug in, what they draw, what charging costs, and how far the charging network has got.
Views in this section
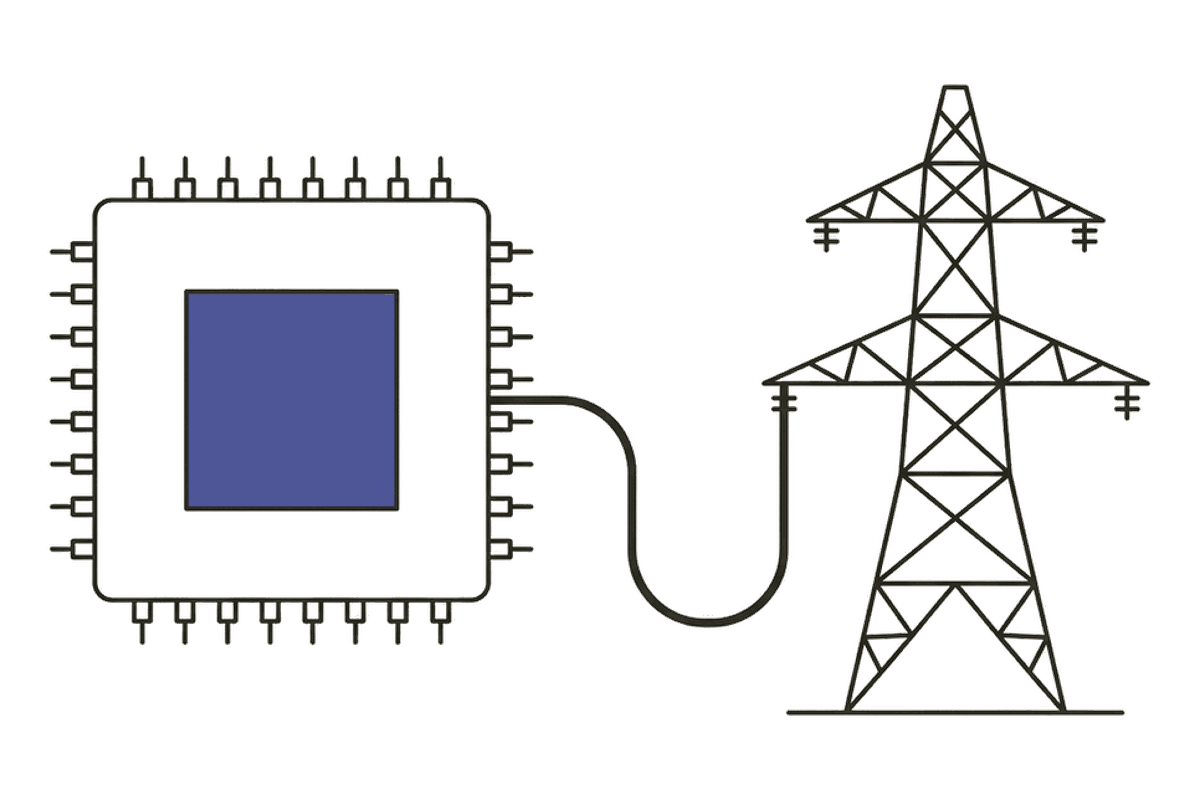
What does AI draw from the grid?
The Load
Data centres were a flat line on the grid for the best part of a decade, until the cloud and then AI. Few countries meter them. Ireland does: there they took 23% of the electricity in 2025.
Views in this section
What gets built, and how fast?
The Build-out
Solar became the world's largest source of new capacity in the 2020s: 2 391 GW stood at the end of 2025, 11 times the fleet of 2015 (Ember). Where it went, how fast, and how much of the time it runs.
Views in this section
Ask about anything on the site
- Why is electricity usually cheapest in the middle of the day?
- Why did data-centre electricity use stay flat for so long before AI took off?
- How much solar and wind capacity does Germany have, and how fast is it growing?