A day on the grid

One German day, hour by hour, and the site that explains it. Wattlas turns open electricity-market data into 36 views in eight sections that a stranger can read, with every caveat kept on screen.

A horizon of the grid on one ground line: a wind turbine, pylons with sagging cables, a solar panel, a house, a car at a charging post and a data centre, under one blue sun
Wattlas · wattlas.netBuilt and run by Sebastian KnödelFigures as of 23 September 2026; the data refreshes twice a monthAdvance with → or click an hour on the rulerDownload the PDF

03:00Night. Even the quietest hour needs power.

At three in the morning Germany draws about 44 GW, the low point of the day. Wind covers what it can; the rest is coal, gas, biomass, hydro and imports.

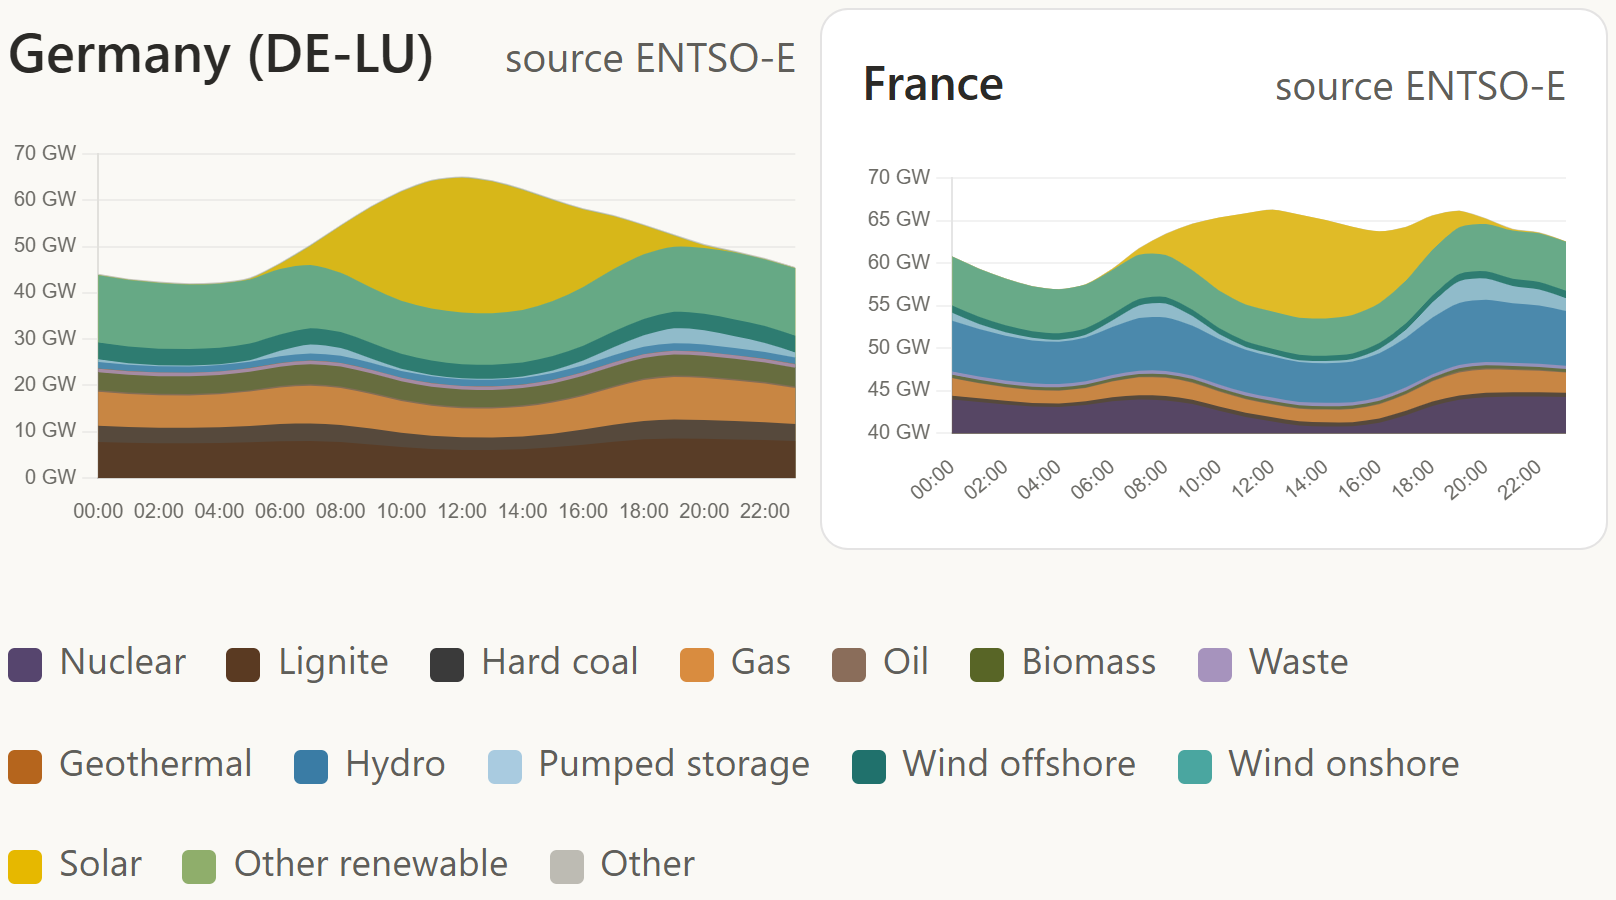
Wattlas shows that mix hour by hour for any bidding zone, two side by side: France's flat nuclear baseload against Germany's wind and gas. From the same feed it works out how clean each hour is: the average French hour sits near 80 gCO₂ per kWh, the average Polish one near 550.

44 GWwhat Germany draws at three in the morning, the low point of the average weekday · 12 months to 14 Sep 2026

Gaps in the source show as gaps in the chart. Carbon is production-based, on UN climate panel (IPCC) lifecycle factors, and the page says so beside the number.
Line drawing: a wind turbine, a solar panel, a dam and a power station wired to one pylon
Generation by fuel, Germany, the lead chart of the Generation Mix view as it renders on wattlas.net
The live view, /generation-mix: each fuel keeps one colour on every page.

07:00The morning ramp. The model has gas setting the price.

Between five and seven demand climbs by about 9 GW, and the average weekday price climbs with it, from €105 to €139/MWh. Solar hasn't arrived. Something has to switch on, and what switches on sets the price for everyone.

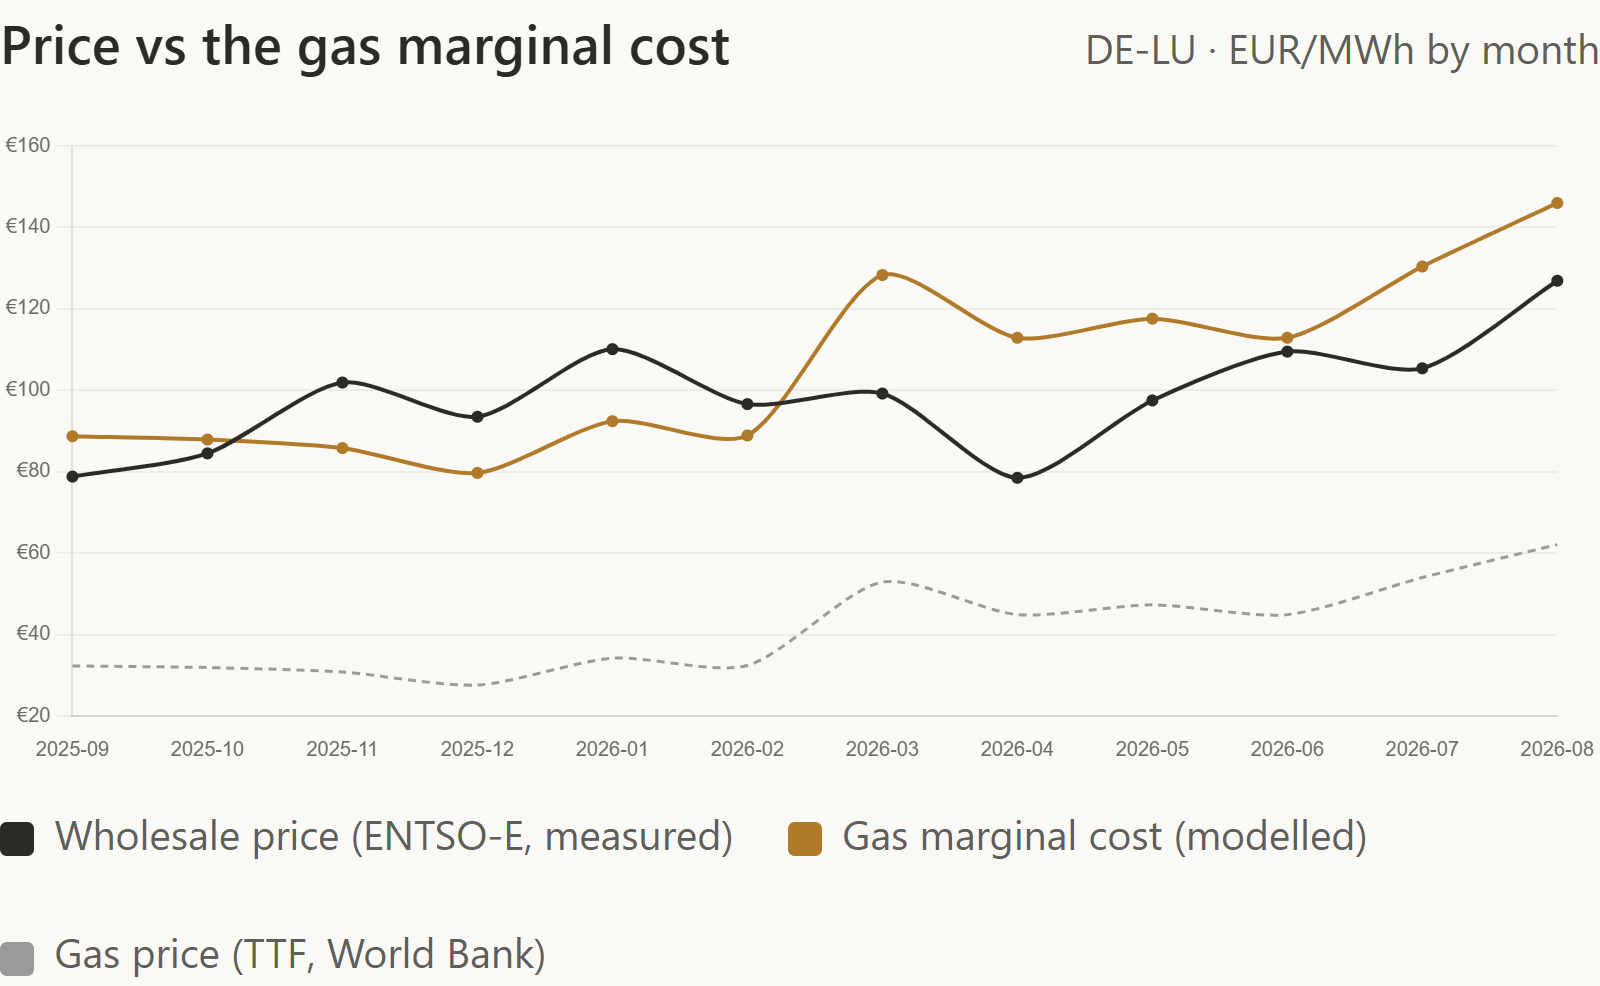
Wattlas answers what with a model, and says so: it prices a gas turbine's running cost from the European gas price (TTF), plant efficiency and the EU carbon price, and reads it against the day-ahead price, day by day. On two days in three the two meet.

66%of the 351 days the model could classify, it says gas set the price · Germany, 12 months to 14 Sep 2026

A model: it infers the marginal fuel, which nobody observes directly. The gas input is a monthly World Bank benchmark converted at ECB rates, the carbon price a curated EEX value dated on the page.

Line drawing: a gas power plant with a small flame at its chimney and a green price tag hanging from it, a pylon beside it, the sun low on the horizon
Modelled gas marginal cost against the day-ahead price, the lead chart of the Marginal Fuel view
The live view, /marginal-fuel: the model's assumptions are printed under the chart.

10:00The sun rises on a bigger fleet every year.

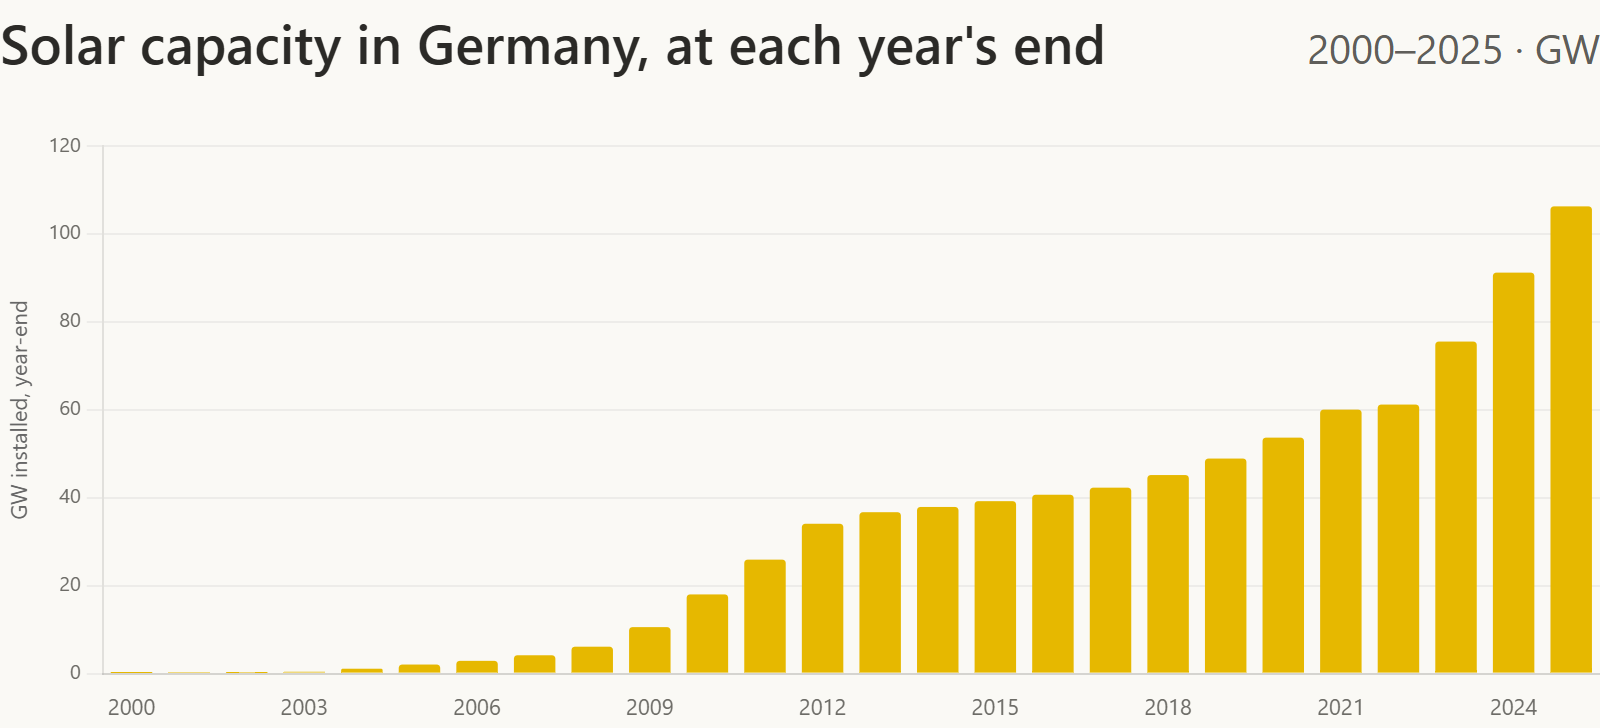
By mid-morning the panels are climbing towards their peak, and there are more of them each year. At the end of 2025 Germany had 106 GW of solar and 78 GW of wind installed; 45 GW of that solar went up in 2023, 2024 and 2025.

Wattlas tracks the build-out for every zone it covers, against the world, the EU and China, and sets the fleet beside the prices it shapes: on the negative-price and capture-price views, each year's new solar sits next to what it did to the midday hours.

10%of its rated power is what Germany's solar fleet delivered across 2025, its capacity factor; wind delivered 20% · Ember, calendar 2025

Capacity is the year-end figure, so in a growing fleet the capacity factor is a lower bound. Germany's solar series changes rating at 2022, from module to inverter, and the page marks the break.

Line drawing: a row of solar panels and a wind turbine growing taller from left to right like a bar chart
Solar capacity in Germany at each year's end, 2000 to 2025, the lead chart of the Renewable Capacity view
The live view, /renewable-capacity: any technology, any country, since 2000.

13:00Solar pushes the price below zero.

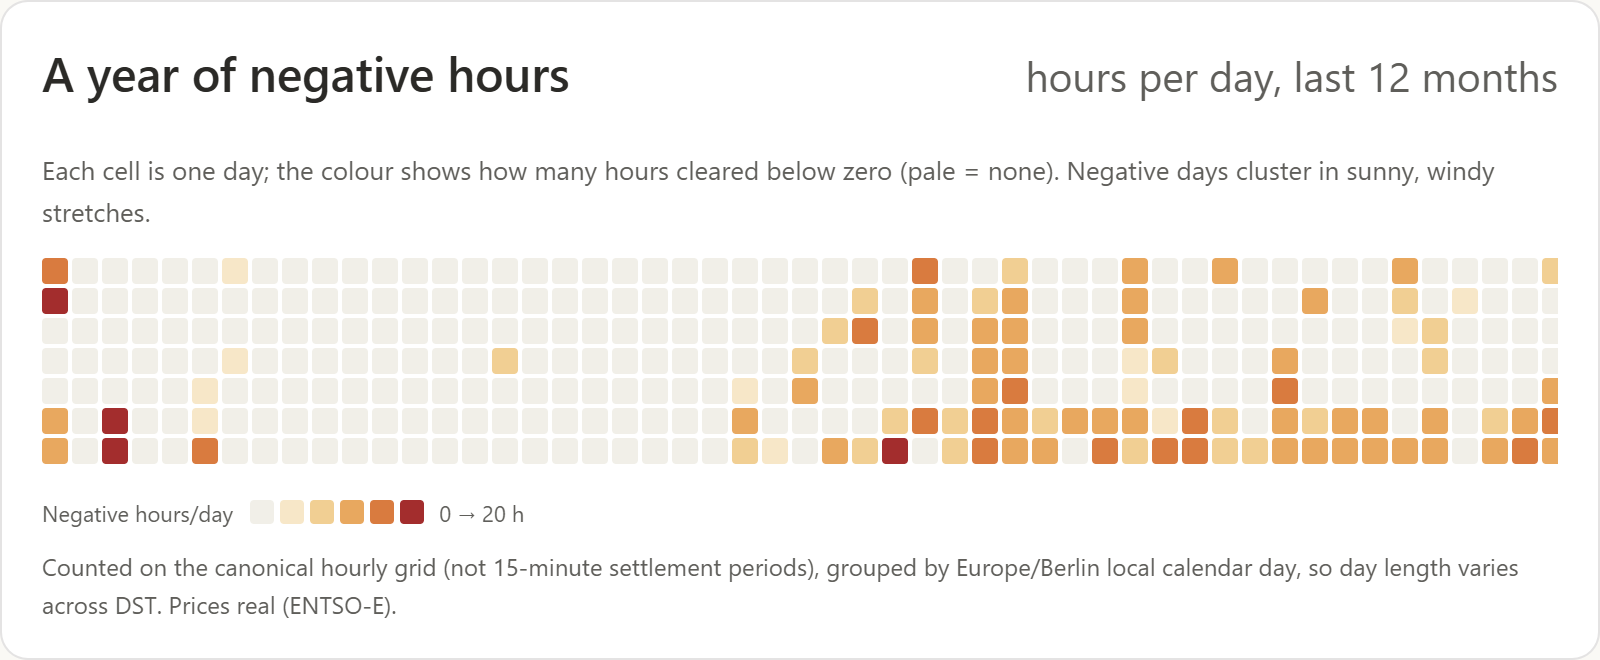
By one in the afternoon solar has pushed the average weekday price to its floor, €58/MWh. On the sunniest, windiest days it falls straight through it. In the 12 months to 14 September 2026 the German day-ahead price was below zero for 535 hours.

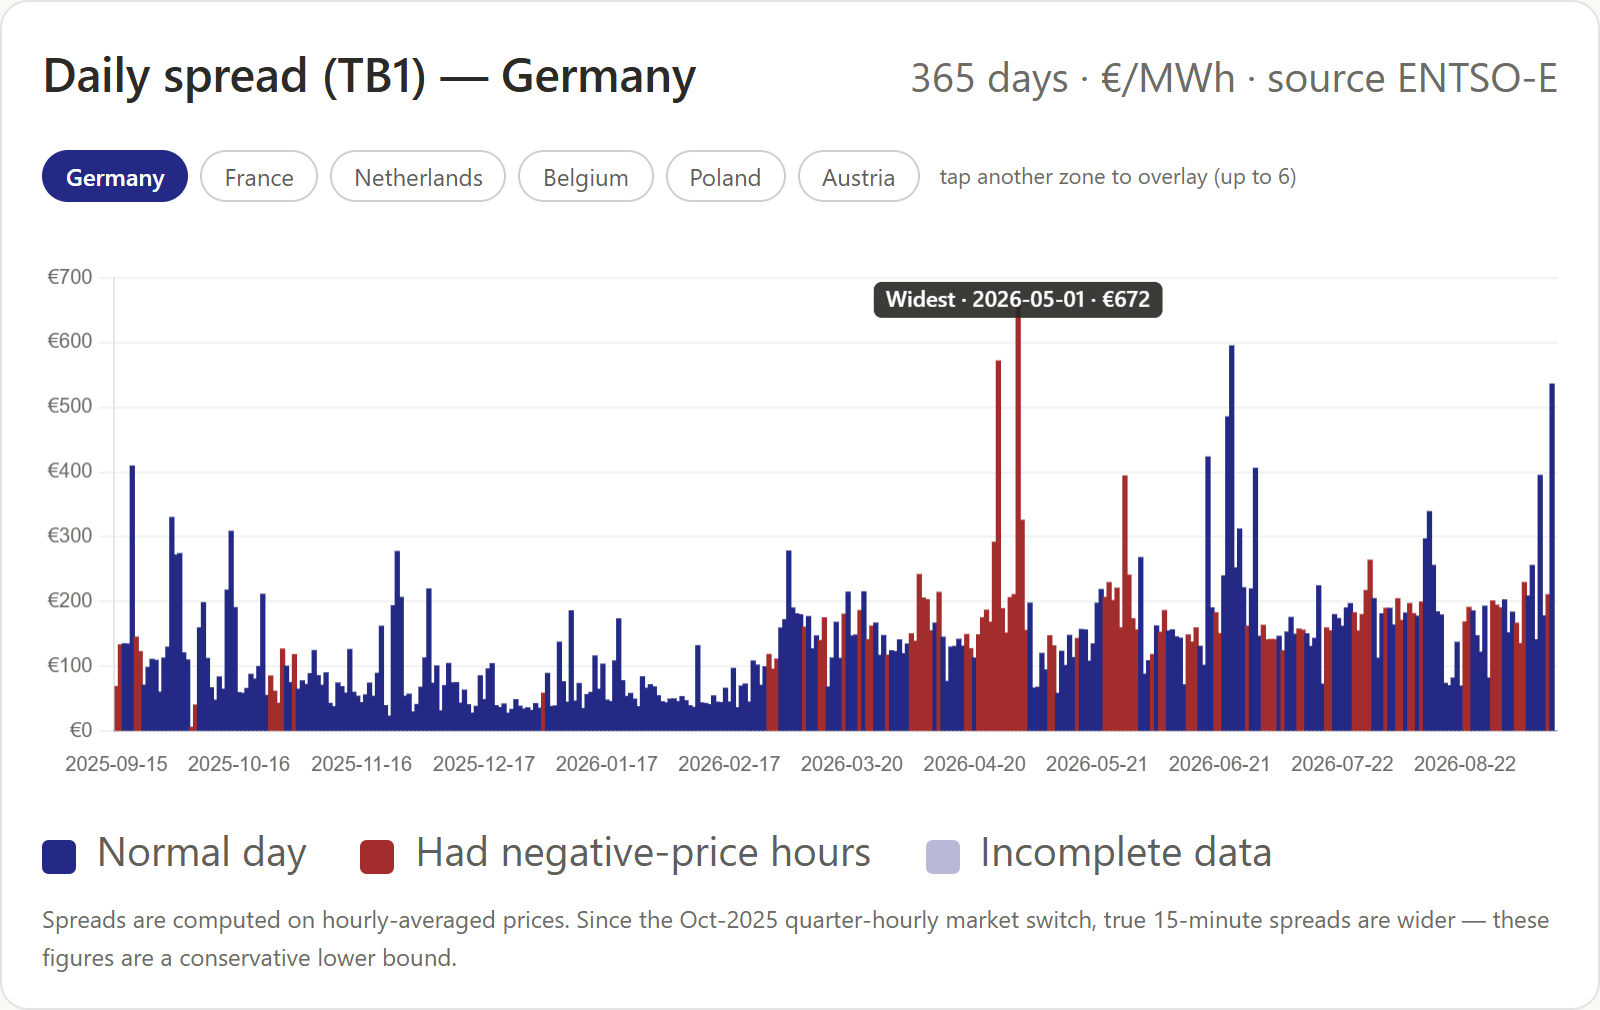
The site counts those hours by year, month, day and spell length. The per-year count reconciles with the regulator's own (BNetzA): its 2024 figure is matched exactly. The widest day of the year was 1 May 2026: a €672 spread between its cheapest hour (−€499) and its dearest (€173).

Hours below zero per calendar year, DE-LU day-ahead, from a frozen five-year backfill; 2022 is the gas-crisis outlier.

Counted hour by hour in local time, negative prices kept as they are. Since October 2025 the market settles quarter-hourly, so the hourly count understates it.

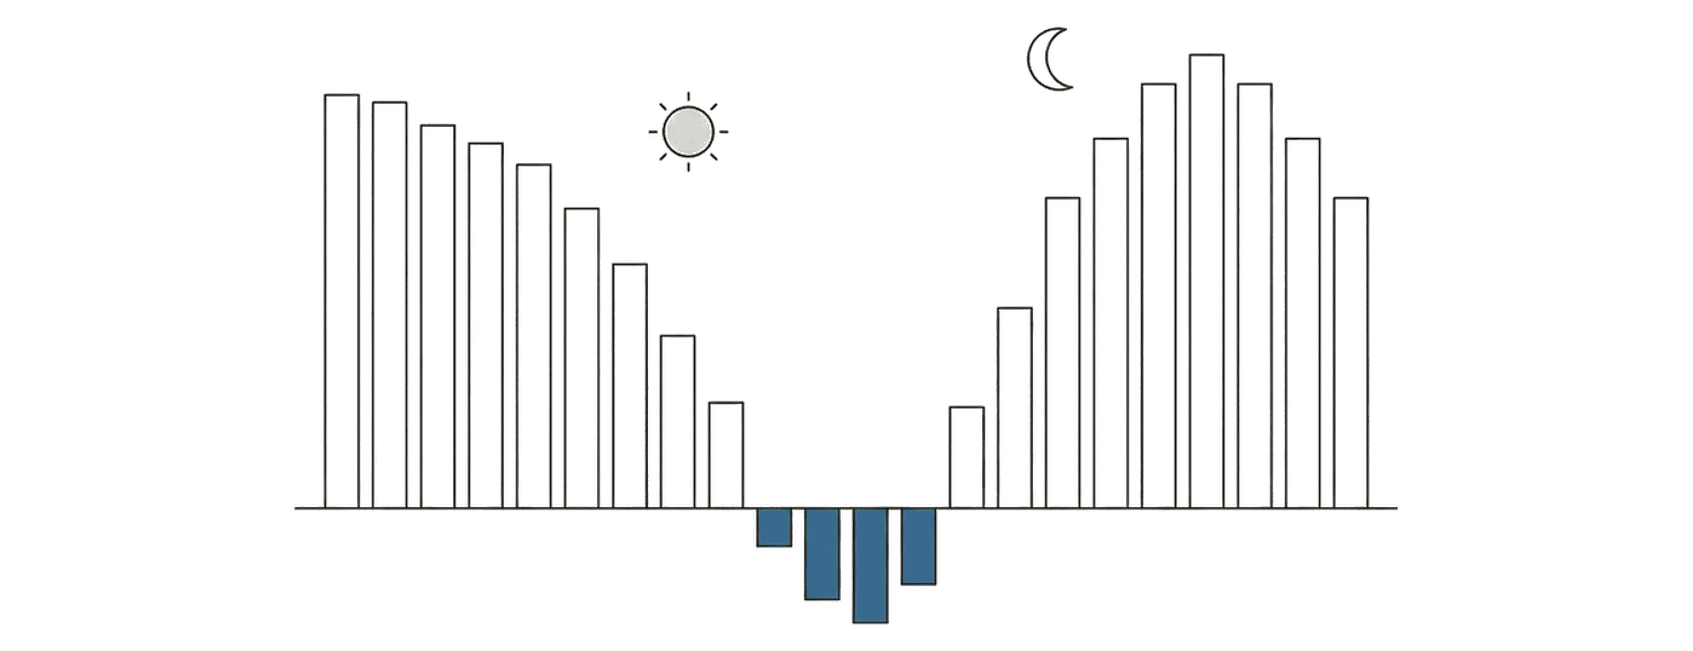
Line drawing: a day's price bars falling from morning to a midday trough that dips below the line in blue, then rising to an evening peak, under a sun and a moon
A calendar of the year, one cell per day, shaded by how many hours the price was below zero: the negative hours cluster around midday from spring to autumn
The live view, /negative-prices: the year as a calendar, one cell a day; any year loads on demand.

14:00The north can't ship it south.

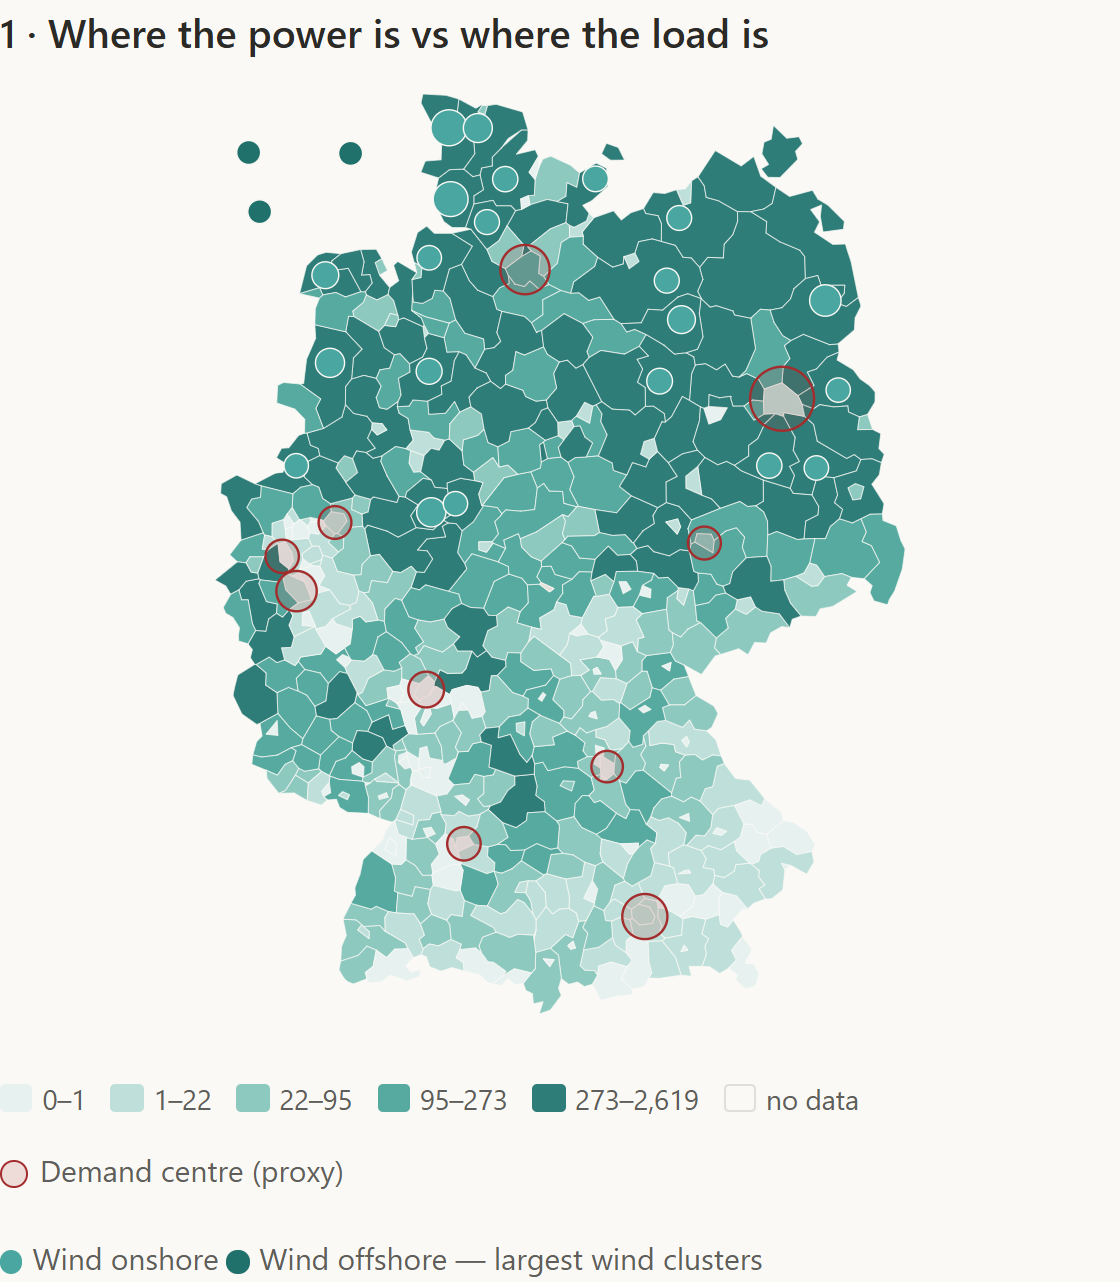
Over the last 12 months the north and east generated 81% of Germany's wind and the industrial south-west 2%, with one price stretched between them. When the lines are full the grid pays northern wind to stop.

13.0 TWhof German wind and solar curtailed in the 24 months to 15 Sep 2026, priced on the page at about €1.0 billion, an estimate, labelled as one

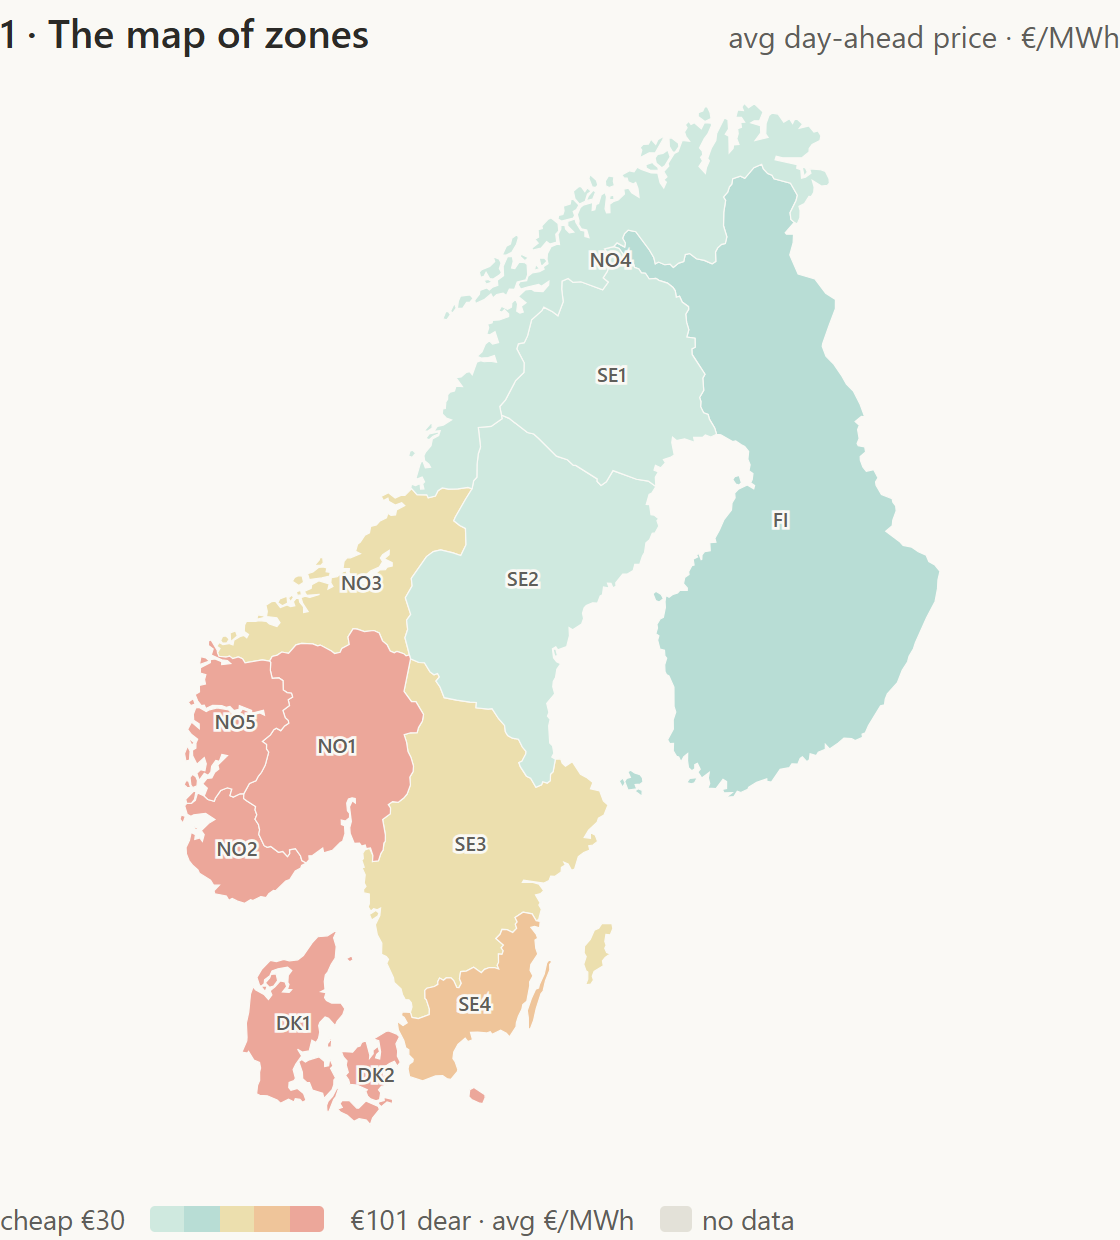
Wattlas goes below the bidding-zone line and maps the same congestion problem three ways. Germany keeps one price and curtails. The Nordics split into twelve price zones: over the last 12 months the hydro-rich north (NO4) averaged €30/MWh, the continent-coupled south (DK2) €101. Britain keeps one price and pays constraint costs instead: £7.2 billion since April 2022, per NESO.

Map of Germany's Landkreise shaded by installed wind capacity, from the Germany North–South view
Germany one price, curtail~400 Landkreise (counties) from the plant register (MaStR), control-area balance from SMARD.
Schematic map of the twelve Nordic bidding zones shaded by average day-ahead price
Nordics twelve pricesENTSO-E zone prices; boundaries labelled approximate.

Curtailment is a managed grid-stability measure: operators turn generation down to keep the system stable. The single-zone debate is presented as a cited range, and the site never invents a split price.

19:00The evening peak, when batteries sell.

At seven the sun is gone and demand isn't. The average weekday price peaks at €163/MWh; the residual load (demand minus wind and solar) peaks at 40 GW. A battery earns from the gap between a day's cheapest and dearest hour.

€137/MWhthe average daily top–bottom spread (TB1), DE-LU, 12 months to 14 Sep 2026

Wattlas runs a modelled 1 MW / 2 MWh battery through the real price profile and states what perfect foresight would earn: about €95 000 per MW a year. Germany's large-scale fleet grew from 0.6 GW at the end of 2021 to 2.6 GW at the end of 2025 in the German plant register (MaStR), with 11.6 GW more registered as planned: a registration, with no promise it will be built.

The arbitrage figure is an upper bound: it assumes perfect foresight, no round-trip losses and no price impact. Real batteries earn less. The spread itself is a conservative lower bound since the quarter-hourly switch.

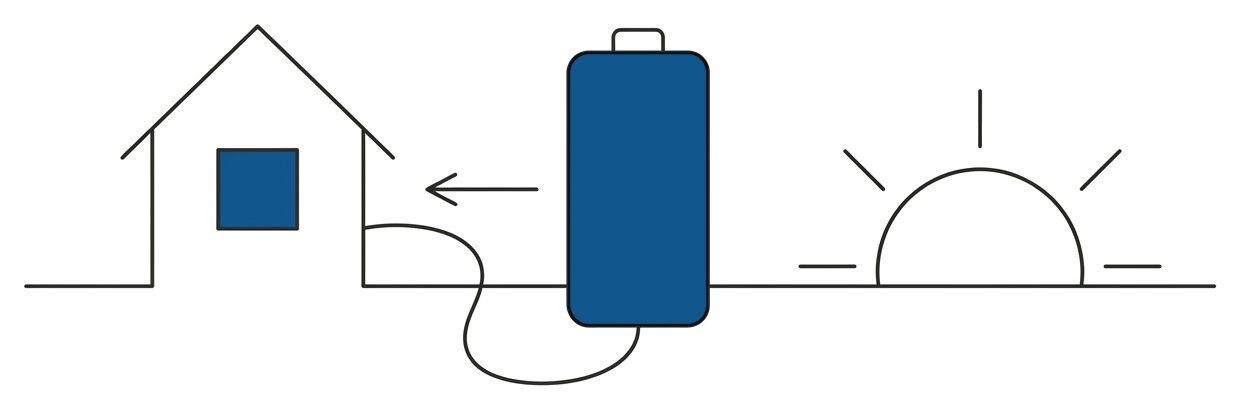
Line drawing: a house with one blue lit window, a large battery beside it with an arrow pointing to the house, the sun setting on the horizon
Daily top–bottom spread, Germany, the lead chart of the Spread view with negative-price days flagged
The live view, /spread: negative-price days flagged, the upper-bound caveat under the chart.

22:00A November night with no wind.

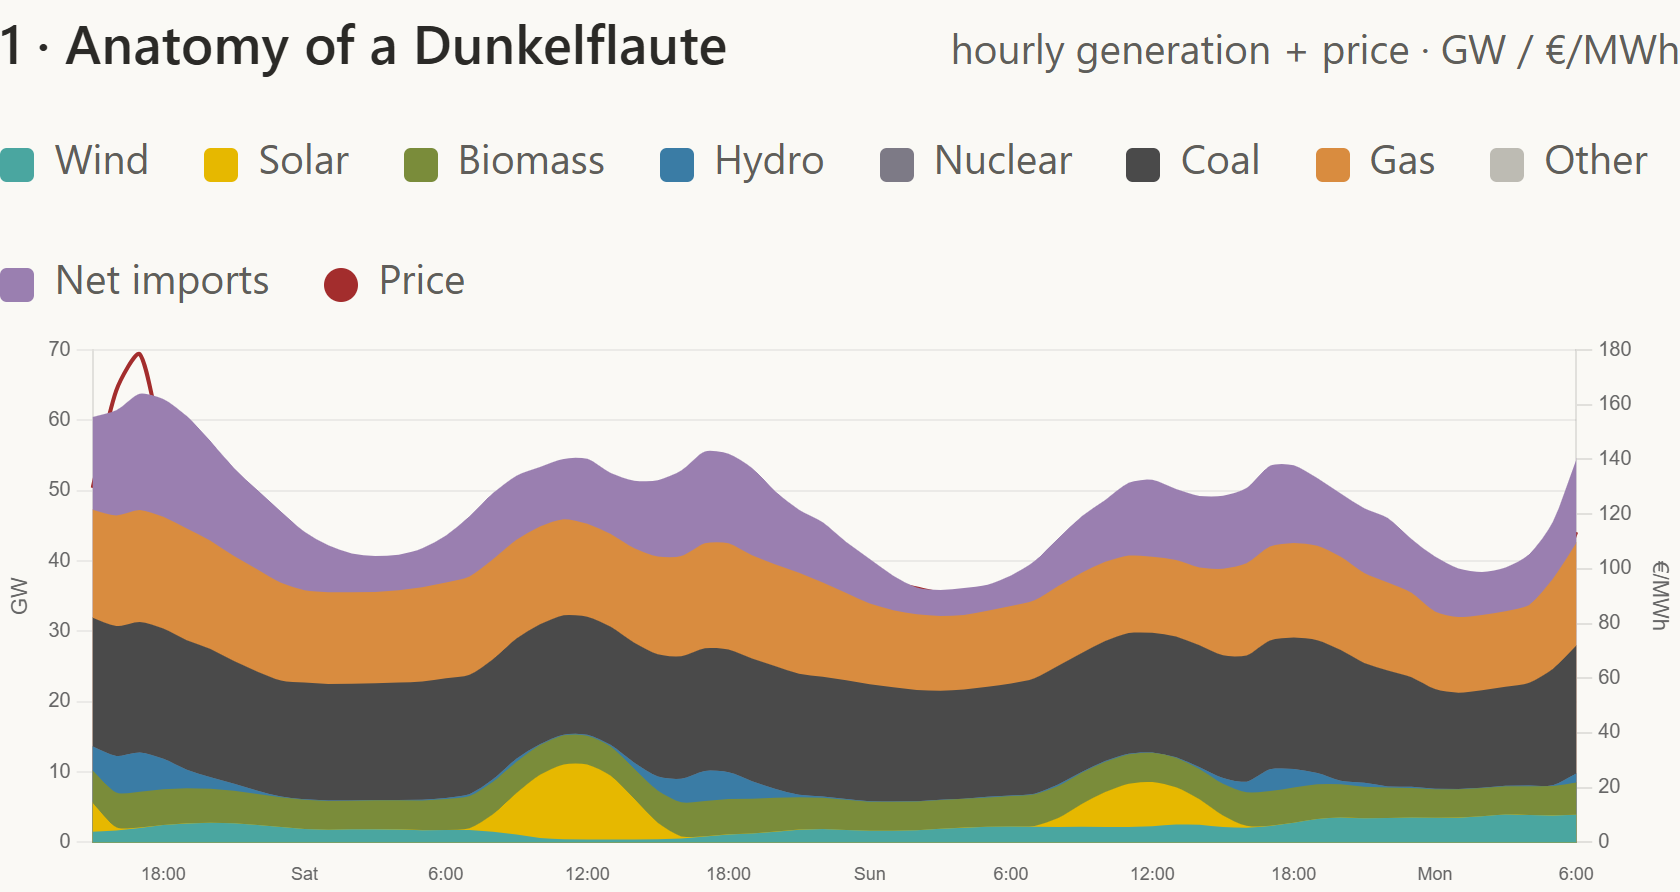
For 52 hours in November 2025, wind and solar together covered 9% of German demand, against a normal 50%. A Dunkelflaute. Coal, gas, biomass, hydro and imports carried the load, and the price climbed.

The site finds the worst such spell in the last year automatically, plots it hour by hour, and keeps the record across a frozen five-year history: 14 sustained spells since 2021, the longest 97 hours in December 2022. Even on an ordinary day the wind is hard to call: over the last year the grid operators' day-ahead forecast missed onshore wind by 10% of its output. Germany's answer to the long gaps is a law passed in July 2026, the StromVKG, which auctions 11 GW of firm capacity for 2031.

14 timesfrom 2021 to 2025, wind and solar covered less than 10% of German demand for a day or longer · the longest lasted 97 hours

The page shows what covers such spells (firm capacity, storage or interconnection) and argues neither for nor against renewables. The law is enacted; its cost is the European Commission's expected range, and the levy an estimate until its own law sets it.

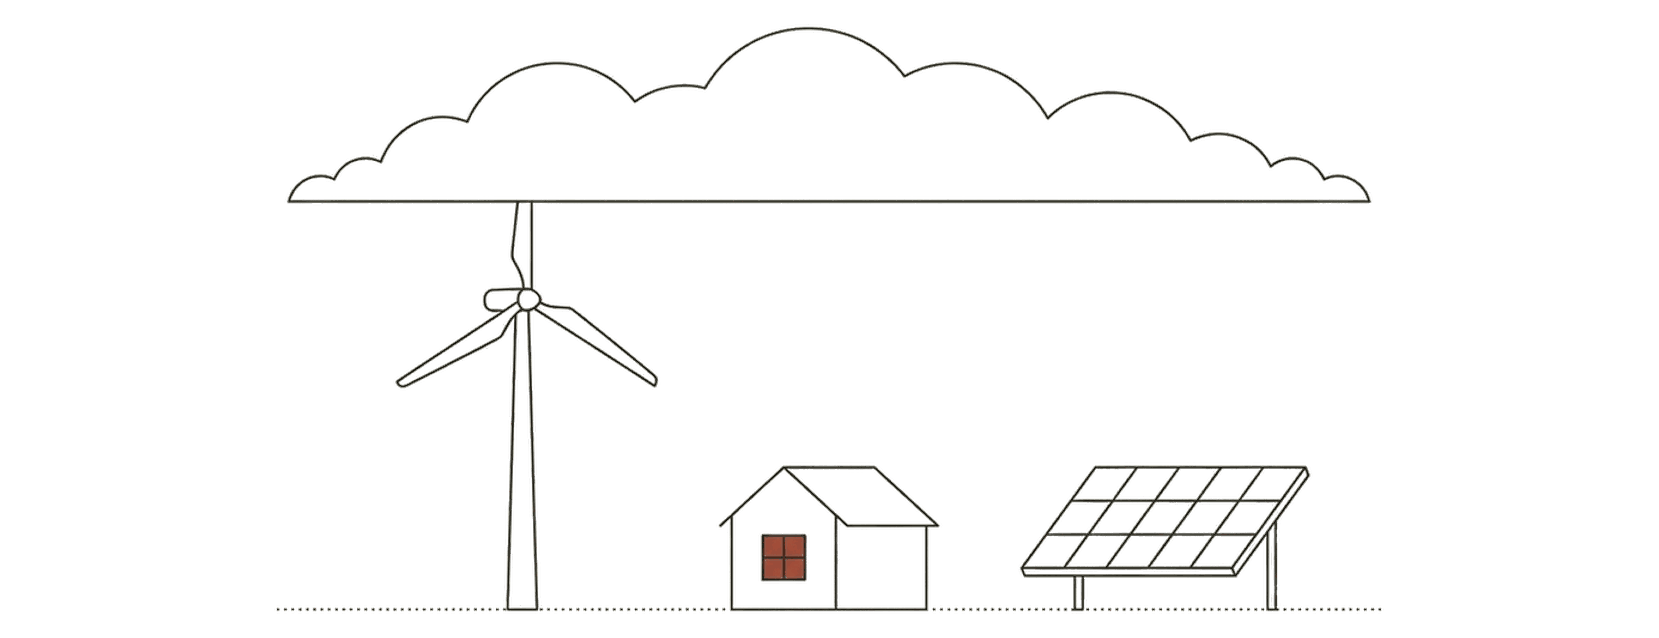
Line drawing: a flat bank of cloud over a still wind turbine, a house with one red-lit window and a solar panel
The worst low-renewable spell of the year plotted hour by hour, the lead chart of the Dunkelflaute view
The live view, /dunkelflaute: the spell of 7–10 November 2025, hour by hour; the threshold is adjustable and stated.

23:00While you sleep, the new loads plug in.

Germany had two million battery-electric cars at the end of 2025. In 2024 road vehicles used 5.9 TWh, 1.25% of the country's electricity by Eurostat's energy balance, and they are the first big load that can choose when it draws.

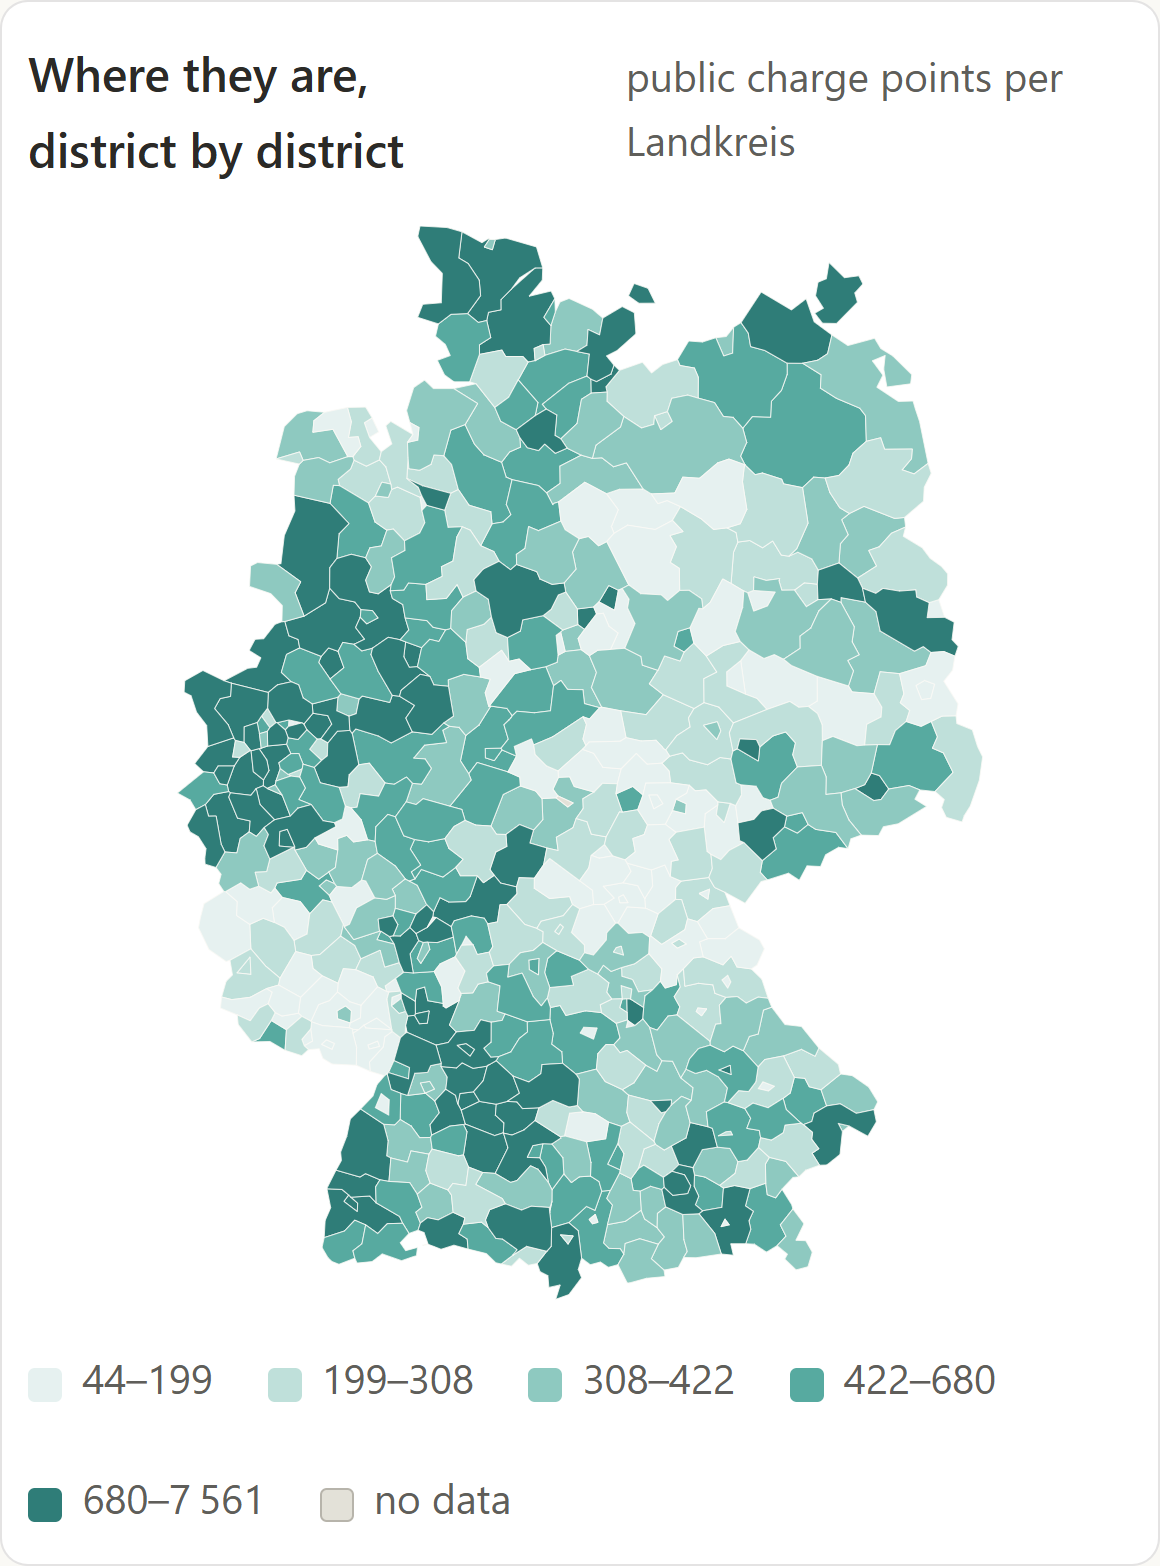
209 098public charge points at 116 423 sites, 9.1 GW, from the Bundesnetzagentur's register · 1 Sep 2026 · public points only; the real network is larger

Few countries meter data centres. Ireland does: there they took 23% of the country's electricity in 2025. The Netherlands does too: 4.6% in 2024. Everywhere else the number is a published estimate, and Wattlas keeps every author's estimate as its own line and never averages a measurement into a model.

Line drawing: a teal car at a charging post, its cable running up to a pylon Line drawing: a processor chip wired to a pylon
Germany's public charge points by Landkreis, the lead map of the Charging Network view
The live view, /ev-charging-network: every one of the register's points placed in its district.

24:00 month endThe bill lands.

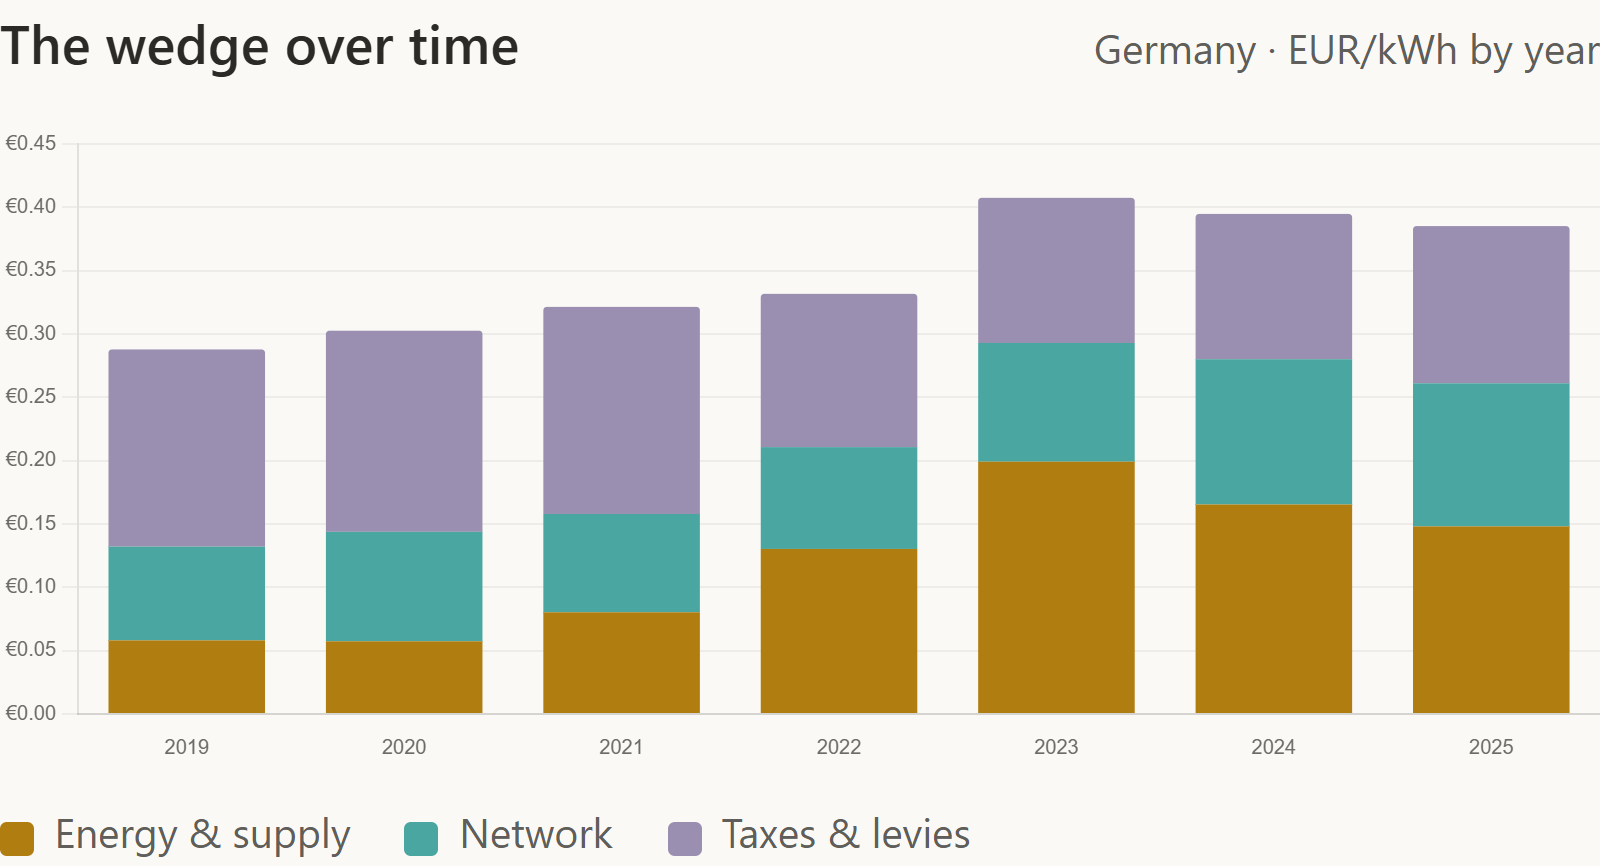
A German household paid about 39 ct/kWh in 2024. The energy itself was 17 ct of that; network charges 11 ct; taxes and levies 11 ct. The wholesale price this deck has followed all day is a minority of the bill.

What can a household do about it? Shift load into the cheap hours. An EV charging in the cheapest four hours of each day would have saved about €210 over the last 12 months against a flat tariff; a home battery about €260.

Those savings are a perfect-foresight upper bound; real charging and batteries save less. Eurostat's figures are per kWh for Germany; the wholesale price is per MWh for the DE-LU zone.

Line drawing: a plug pulled from a wall socket, its cable carrying a plum price tag
The household price split into energy, network and taxes over the years, the lead chart of the Electricity Bill Breakdown view
The live view, /electricity-bill-breakdown: how the wedge has shifted since 2019.

05:17 UTC · the 1st and the 15thThe site's own day begins before dawn.

Twice a month a scheduled job fetches more than a dozen open feeds, computes every metric in Python and writes the small JSON files the pages read. Firebase Hosting publishes whatever changed.

The browser gets static pages: no framework, no database, no map tiles, so an API outage cannot take the site down. The only code running on a server is the assistant.

A view can be up to two weeks old between runs, and every page says when its data was updated.

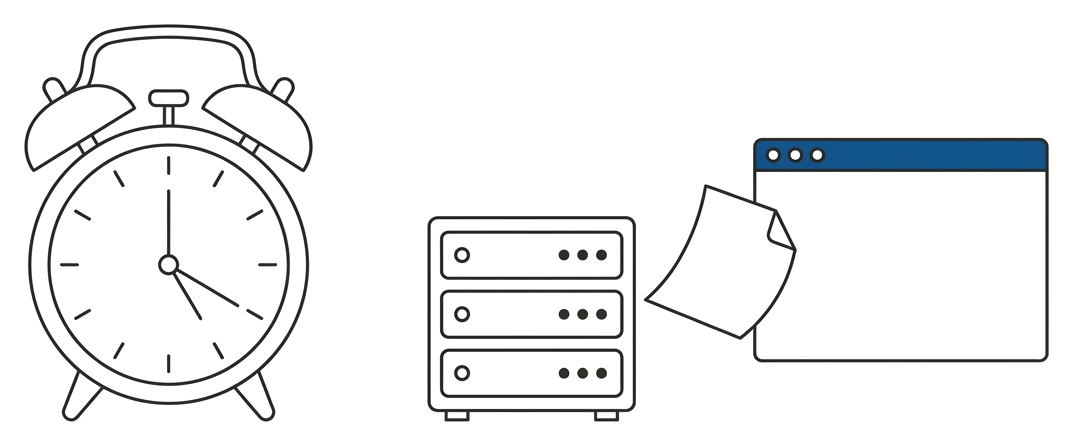
Line drawing: an alarm clock with its hands at 5:17, a small server rack, and a sheet of paper gliding into a browser window with a blue title bar
Open dataENTSO-E, SMARD, MaStR, NESO, Eurostat and more
pipeline/Python and pandas, one module per source
data/*.json64 pre-computed files, committed
site/59 static pages, vanilla JS, D3 maps
FirebaseHosting, plus the assistant's functions

any hour the assistantAsk the page a question.

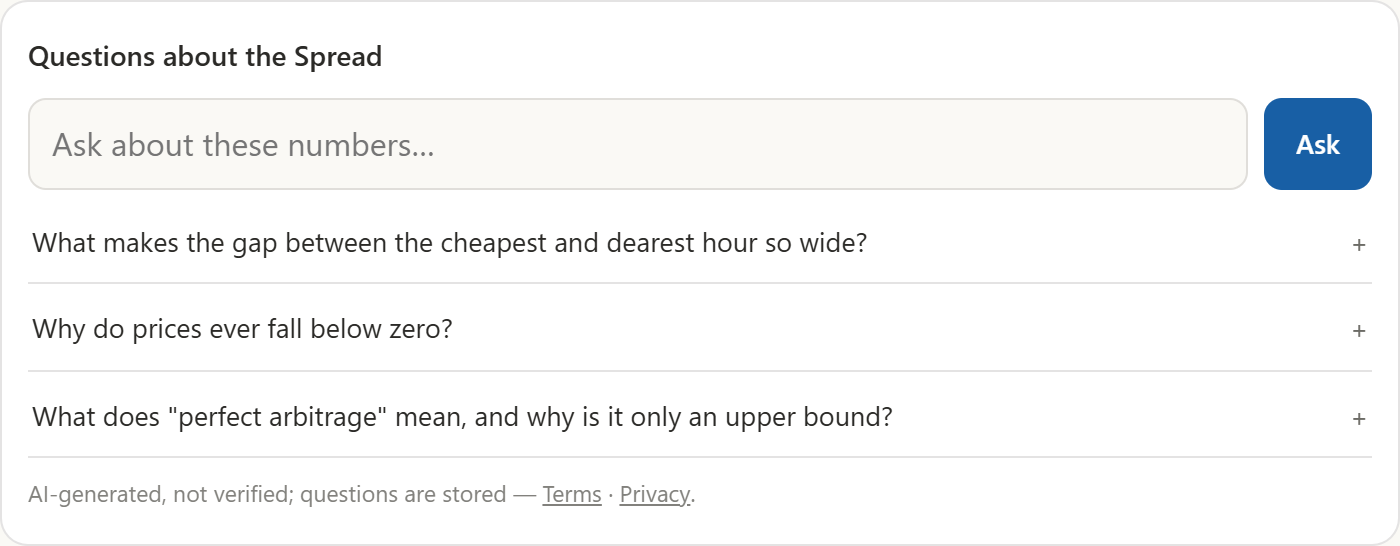
Every view has a small assistant under its chart. Ask it about the numbers in front of you and it answers from that page's own data, and nothing else.

The server fetches the page's data itself, so a question cannot slip in other numbers, and when an answer leaves out the view's caveat, the caveat is added. Each page's three suggested questions are answered ahead of time and served as plain files.

44 pagescarry the assistant · 3 questions free per visitor every 30 days, 20 a day after signing in

Answers are labelled AI-generated and unverified on screen. Questions are logged on the server with no account attached, and the browser keeps no record of them.

Line drawing: a bar chart with a plum luggage tag tied to its tallest bar
The assistant on the Spread view: a question box and three suggested questions about the daily price gap, negative prices and the arbitrage upper bound
The live view, /spread: the question box and its three suggested questions.

00:00 tomorrowHave data people need to understand?

I build the whole path from raw data to a page a newcomer can read: the pipeline, the interface and the caveats that travel with every number. Wattlas is the working example, built and run by one person.

If your organisation has numbers that deserve a clear page, write to me.

Sebastian Knödel · data engineering and product design · sekond.de

The same horizon of the grid at night: turbine, pylons, solar panel, house, car and data centre under a crescent moon