Home/Country by Country
09

How does each country make and price its power?

Country by Country

Each European power system has its own mix of fuels, its own price zones and its own answer to the same problem: matching supply to demand hour by hour. Each country's figures come from the views that compute them.
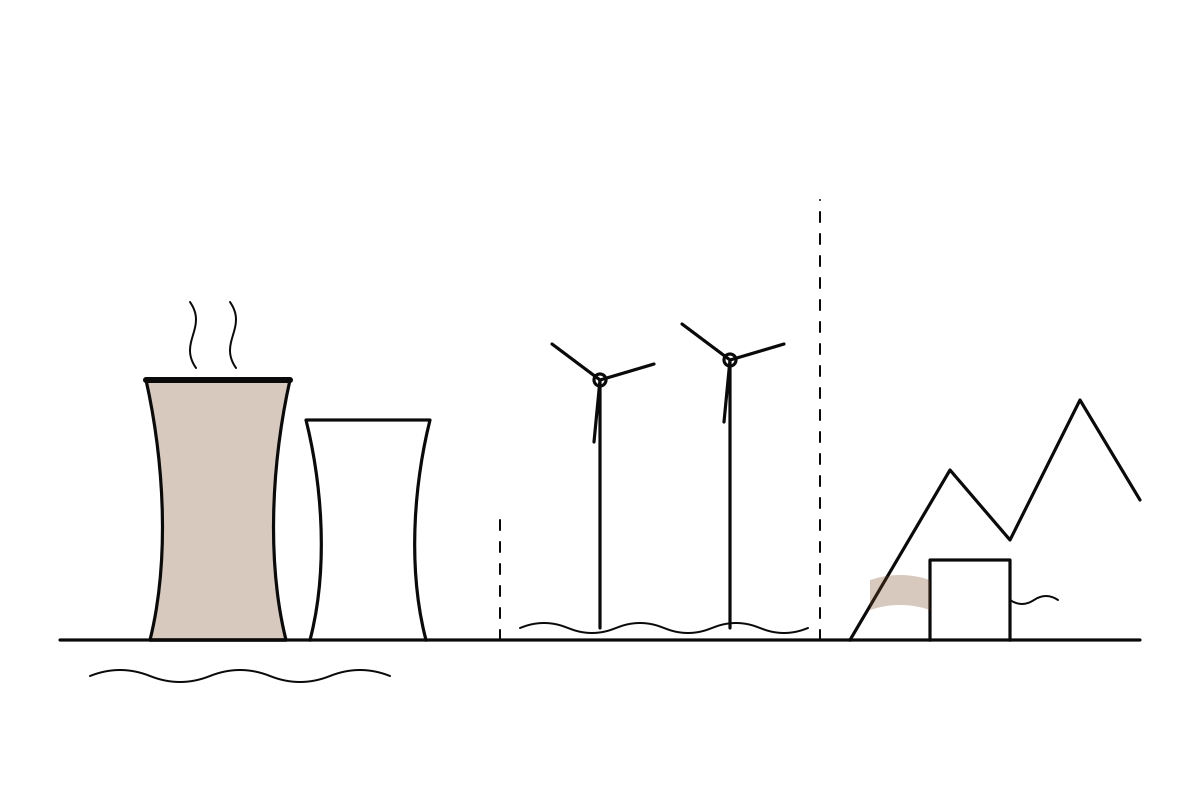
One ground line running across Europe's power systems: cooling towers, wind turbines at sea, a hydro dam in the mountains, split by dashed price-zone borders
Germanyhours below zero, 12 months474 h Francenuclear reactors, 69% of output57 Spainhours below zero, 12 months766 h Italymedian daily spread, north103€/MWh Netherlandshours below zero, 12 months404 h Belgiumhours below zero, 12 months306 h PolandgCO₂ per kWh, 12 months552 gCO₂/kWh Austriarenewable share of generation75% Denmarkrenewable share, West (DK1)91% Norwayfive price zones32–101€/MWh Swedenfour price zones41–84€/MWh Finlandaverage day-ahead price55€/MWh United Kingdoma year to switch wind off£1,7 billion Irelandof electricity to data centres, 202523%
Next questionWhen does power move? →The Daily Rhythm
Wattlas

European electricity, explained: open data on when, where and how much the price of power moves.

Built by Sebastian Knödel

Explore

The Daily RhythmWhat's on the GridGeography of PriceWhen the Grid Is TestedThe BillThe ChargeThe LoadThe Build-outCountry by CountryAll views

About

About WattlasHow it worksMethod notesData sourcesMonthly newsletterShowcaseA day on the gridHow it's built

Legal

ImpressumPrivacyTerms and disclaimerContactCookie settings
Open data from European grid operators, regulators and statistics offices; each figure names its source. Figures are computed in advance; the assistant, the contact form and the mail sign-up run live. Not financial advice.© Wattlas · open data