What's flowing through the wires?
What's on the Grid
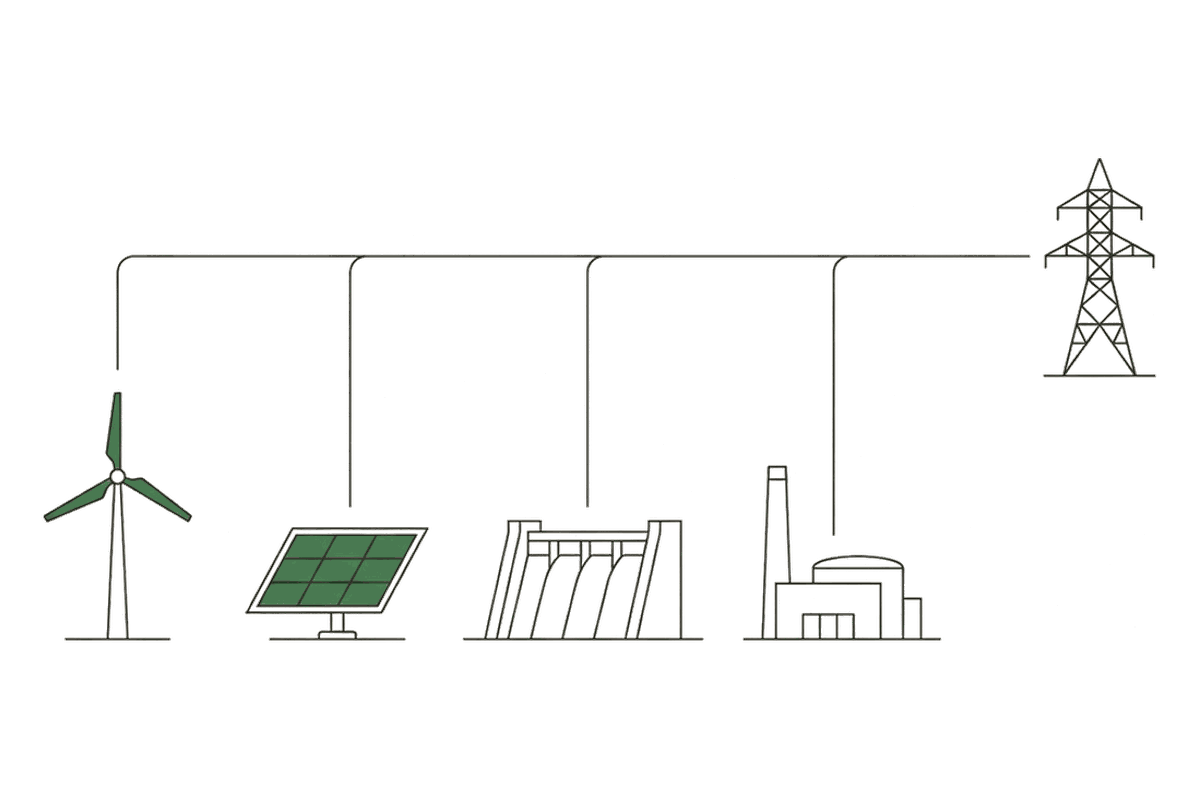
Behind every price is a physical mix of fuels. This is what generates Europe's power hour to hour, and how clean or dirty each hour is.
Ask about this section
- Why does the French mix look so flat next to the German one?
- Which country here has the cleanest power, and what makes it clean?
- Why does the peak residual hour matter more than the peak demand hour?
Generation Mix measured
Generation by fuel for any bidding zone: France's steady nuclear beside Germany's changeable wind and solar. Inside the view: The fleet behind the output.
What is generating the electricity in a given country right now? →Method: Production-based carbon intensity, The generation mix.
Carbon Intensity estimate
How many grams of CO₂ each kilowatt-hour carries, computed from the generation mix. Inside the view: Carbon by hour of day.
What do grams of carbon dioxide per kilowatt-hour measure? →Method: Production-based carbon intensity, Renewable share of generation.
Residual Load measured
Demand minus wind and solar: what other plants and batteries must still cover.
What does residual load mean in plain terms? →Method: The canonical hourly grid, Residual load.
Marginal Fuel estimate
A model of the hours when a gas plant sets the price: its running cost against the day-ahead price, hour by hour. Inside the view: What sets the price · How the model works.
What does it mean for gas to set the electricity price? →A model: it infers when gas sets the price, which nobody observes directly. Method: The marginal-fuel model.
Midday Ramp-down estimate
When solar peaks at midday, how far the plants that can turn down do turn down, in six bidding zones, fuel by fuel, and at what price. Inside the view: The fixed-cost arithmetic.
When solar peaks at midday, which plants turn down, and by how much? →Method: The canonical hourly grid, The midday ramp-down of dispatchable plants.