When does power move?
The Daily Rhythm
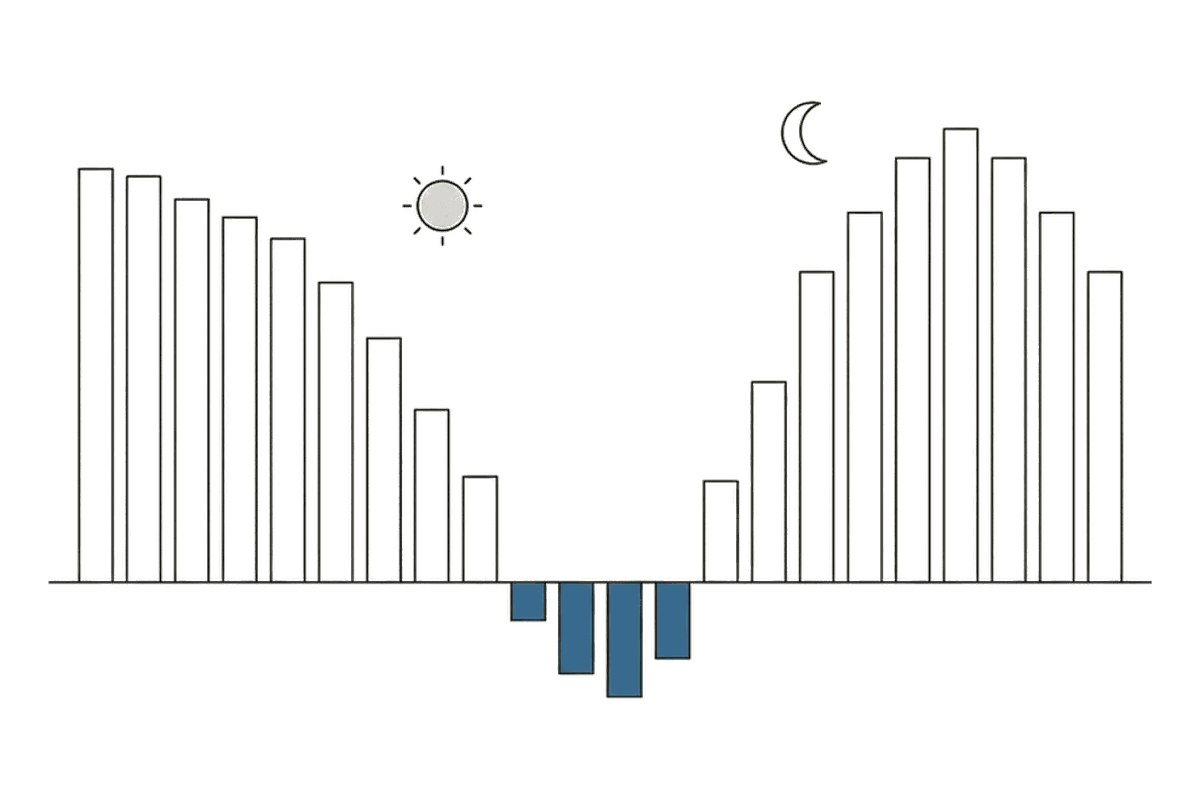
Electricity has no single price. It has a price every hour, and since October 2025 every quarter-hour. It swings between cheap and expensive, day to day and year to year.
Ask about this section
- Does the evening peak reach my bill if I pay a flat rate?
- Why do prices ever fall below zero?
- Who gets paid when the price goes negative?
Pulse measured
Prices dip at midday when solar output peaks and rise after dark. Traders call the shape the duck curve.
Why is electricity usually cheapest in the middle of the day? →Method: The canonical hourly grid, The hour-of-day price profile.
Spread measured
The daily gap between the cheapest and dearest hour, which a battery earns its living from. Inside the view: Negative-price hours per month.
What makes the gap between the cheapest and dearest hour so wide? →The battery-arbitrage figure is an upper bound: it assumes perfect foresight, charging and discharging at each day's best hours, and no round-trip losses. Real battery revenue is materially lower. Method: The canonical hourly grid, The daily spread (TB1 and TB2), The perfect-foresight arbitrage bound.
Negative Prices measured
The hours when the wholesale price drops below zero and producers pay to keep generating. Inside the view: A year of negative hours · How long do they last?
How can the price of electricity end up below zero? →Method: The canonical hourly grid, Negative hours and episodes.
Capture Price measured
What a solar or wind megawatt-hour earns, when power is worth least just as there is most of it. Inside the view: Year by year, the decline · The share sold below zero.
What is a capture price, and how does it differ from the market price? →Method: The canonical hourly grid, Capture price and value factor.
History measured
Every day's price spread across several years, with its seasonal shape and its trend. Inside the view: Seasonal shape: average daily spread by month.
Has the daily price gap been widening or narrowing over the years? →Method: The canonical hourly grid, The daily spread (TB1 and TB2).
Price Volatility measured
How much the wholesale price swings each month in six bidding zones since 2021, and what moved with it. Inside the view: Hours below zero, per month.
Has the German wholesale price become more volatile since the gas crisis, or less? →Method: The canonical hourly grid, Monthly price swings by zone.